 There is a certain kind of information in the world of data that makes it possible to identify particular individuals personally. In other words, there is a way to match a specific person to a data record based on the data alone. Such data is referred to as personally identifiable information (PII), and it's crucial when it comes to data science and data analytics projects. After all, PII's leakage would put those individuals' privacy at risk, and the organization behind the data could get sued. In this article, we'll look at a couple of popular methodologies for dealing with PII. Fortunately, Cybersecurity as a field was developed for tasks like this one. Anything that has to do with protecting information and privacy falls under this category of methods and methodologies. Since PII is such an important kind of information, several cybersecurity methodologies are designed to keep it safe and the people behind this information. The most important such methodologies are anonymization and pseudonymization. These methodologies aim to either scrap or conceal and PII-related data, securing the dataset in terms of privacy. Let’s start with anonymization. This Cybersecurity methodology involves scrapping any PII from a dataset. This methodology involves any variables containing PII (e.g., name, address, social security number, financial information, etc.) or any combination of variables closely linked to PII (e.g., medical information with general location data). Although this can ensure to a large extent that PII is not abused, while it also makes the dataset somewhat lighter and easier to work with, it's not always preferable. After all, the PII fields may contain useful information for our model, so discarding it could distort the dataset's signal. That's why it's best to use this methodology for cases when the PII variables aren't that useful, or they contain very sensitive information that you can't risk leaking out. As for pseudonymization, this is a Cybersecurity methodology that entails the masking of PII through various techniques. This way, all the relevant information is preserved in some form, although deriving the original PII fields from it is quite challenging. Although this Cybersecurity methodology is not fool-proof, it provides sufficient protection of any sensitive information involved, all while preserving the dataset's signal to a large extent. A typical pseudonymization method is hashing, whereby we hash each field (often with the addition of some "salt" in the process), turning the sensitive data into gibberish while maintaining a one-to-one correspondence with the original data. Beyond anonymization and pseudonymization, several other Cybersecurity methodologies are worth knowing about, even if you only delve in data science work. If you want to learn more about this topic, including how it ties in the whole Cybersecurity ecosystem, you can check out my latest video course: (Fundamentals of) Anonymization and Pseudonymization for Data Professionals on WintellectNow. So, check it out when you have a chance. Cheers!
0 Comments
 Data modeling of data architecture is the discipline that deals with how data is organized, how various (mostly business-related) processes express themselves as data flows, and how we leverage data to answer business-related questions. It involves some basic analytics (the stuff you'd do to create a pivot table, for example) but no heavy-lifting data analysis, like what you'd find in our field. There is no doubt that data modeling benefits from data analytics a great deal, but the reverse is also true. Let's explore why through a few examples. First of all, data modeling is fundamental in the structure of the data involved (data architects often design the databases we use) and the relationships among the various datasets, especially when it comes to an RDBS architecture. However, they also work with semi-structured data and ensure that the data is kept accessible and secure. Over the past few years, data modelers also work on the cloud, ensuring efficiency in how we access the data stored there, all while keeping the overall costs low. So, it's next to impossible to do any data-related work without consulting with a data architect. Since data modeling is the language these professionals speak, we need to know it, at least to some extent. Data modeling also involves generating reports based on the data at hand. These reports may need to be augmented using additional metrics, which may not be very easy to compute with the conventional analytics tools (slicing and dicing methods). So, we may need to step in there and build some models to make these metrics available for these reports. Before we do, however, we need to know about their context in the problem at hand. This context is something some knowledge of data modeling can help provide. Apart from these two cases, there are other scenarios where we need to leverage data modeling knowledge in our pipelines. These, however, are project-specific and beyond the scope of this article. In any case, having the right mindset in data science (and data analytics in general) is crucial for bridging the gap between our field and data modeling. This is something I explore in all of my books, particularly the Data Science Mindset, Methodologies, and Misconceptions one. So, check it out when you have a moment. Cheers.  This topic may seem a bit strange, but I'm running out of ideas here! Still, it's interesting how often this topic comes about in mentoring sessions, especially when dealing with A/B testing. So, if you can't answer the question "when are two numbers equal enough?" in a simple sentence, perhaps you'll have something to learn from this article. First of all, the rationale of all this. Sometimes, we need to make an executive decision about whether we should apply this or the other function on the data at hand. In A/B testing, this is usually something like “should we go for the equal variances or the unequal variances variant of the T-test?” Of course, when you have two samples, the chances of their variances being exactly equal is minuscule, so why did those old sages of Stats whom we revere so much decide to have two variants of the T-test, based on the equality of the variances involved? Well, there is a different formula used since if the variances are the same, things are much simpler with the underlying math. But then the question becomes "when are these two variances equal?" and keep in mind that we are talking Stats here, so the rigidity of Math as we know it doesn't apply. We are comfortable with approximations, otherwise, we'd have to abandon the whole idea of Statistics altogether! In engineering, two numbers are equal when their difference is within a tolerance margin. We usually depict this tolerance by a threshold th expressed as a negative power of ten. So, often we have something like th = 10^(-3), which is a fancy way of saying th = 0.001. This kind of approximation, although very handy, may not apply to the problem at hand. Besides, few disciplines have the scientific reasoning and discipline that Engineering exhibits, and Stats is not one of them. Also, let's not forget that traditional Computer Science is akin to Engineering, so the approx() function found in many languages follows a similar motif, making it inapplicable to the problem mentioned previously. In Physics, things are a bit different, which is why often we talk about orders of magnitude. So, it's often the case that if two quantities A and B are different by at least an order of magnitude, they are much different. This is another way of saying that one is at least ten times bigger than the other. This is something we can apply to our problem since it gives us a relative rule of thumb to work with. Of course, an order of magnitude is quite a bit when we talk about variances, but we can adapt this to something that makes more sense in Analytics work. So, what about a fixed percentage, maybe one order of magnitude less than 1? This would translate into 10% (since 1 = 100%), something that's not too much but not negligible either. So, if v1 and v2 are the two variances at hand, we can say that if v1 <= (1+10%)v2 and v2 <= (1+10%)v1, we can presume v1 and v2 to be more or less equal. Additionally, this wouldn't work if one of them is 0, in which case the two variances would always be considered different from each other. Then again, this makes intuitive sense since we'd be dealing with a static variable and one that varies at least a bit. Also, as things are made simpler if we use as a reference point the smaller variance, we can just do a single comparison and be done with it. After all, if v2 is the smallest and v1 <= 1.1*v2, we can be sure that the reverse would also hold true. In other words, we can use a script like the one attached to this article and not have to worry about this matter much (note that this script allows us to use a different threshold too, other than 0.1). Cheers!
 Good documentation is in high demand everywhere, from coding libraries to products and services to even data science projects. The funny thing is that even though many people value communication in data science, not everyone can link good communication and good documentation. Interestingly, even if you are the most charismatic communicator out there, if you don't express your communication skills in your documentation, your data science work will suffer. But why is documentation so valuable? What about visuals? Aren't they worth (at least) 1000 words each? What's the point of dressing up our code notebooks with text too? First thing's first. You don't need to be a technical writer to write good documentation. Just take a look at the documentation of the most mature packages in Julia. Do you think their creators were technical writers? The same goes for other kinds of documentation available online. As long as the reader can understand what you are doing without having to dig deep into the code (or even worse, run parts of the code), your documentation is a decent first draft. That can later be improved, but first, you need to write it! Even if you are the only person to read this documentation, perhaps on a future iteration of that data science project, it's good to do it properly. This way, you won't scratch your head trying to figure out what you were thinking when you put that notebook together. Good documentation is not just about the reader, though. It's also about organizing your thoughts and understanding your code better. Perhaps some refactoring needs to take place, simplifying the whole project. Or maybe some examples could help clarify the objective or the value-add of your script. It's easy to lose sight of these matters when you are entrenched in analytics work, especially the coding part. A well-documented data science project can be a great addition to your portfolio (assuming, of course, that you have the option of exhibiting your work publicly). It's unlikely that someone will go through every line of your code to see what you've done. Still, that person may read at least parts of your documentation, especially the text at the beginning, where you explain the objectives, assumptions, and datasets related to this project. And you can be almost certain that if someone makes it to the end of your code notebook, they'll read your conclusions too. Documentation in data science may not seem as important a skill as knowledge of machine learning, data visualization, etc., but it's a powerful catalyst for all these. After all, just because you create a fancy visual, it doesn't mean that everything is fully comprehensible in it. Perhaps there is so much to see that you need to point the reader to the key findings, which they can then verify by looking closely at the plot. Although good code is self-explanatory, because of its structure and naming conventions, it's always useful to add some text around it. I'm not talking about some comments, but also stuff going beyond the code itself. After all, the code you write is not a work of art (even if you may think that at times!) but a means to an end. That end, along with how the code achieves that end, is something the reader of your code notebook shouldn't have to think about too much. It's better to make it easy for him through good documentation, allowing him to ponder on the whole project, rather than him having to spend all his time trying to figure out what you have done and why. I can go on about this topic until the cows come home. However, an attribute of good documentation is brevity, which is why I'll stop right here. If you find this material of value, you can check out my various books, where I talk about topics like this in more detail. Cheers!  Open-source software is any piece of software that's open to review and edits/forks. In most cases, it's also free and under the GNU license or something equivalent, though when people refer to it as free, they often use the term as a proxy to freedom. As a result, most people refer to open-source software today as FOSS, which stands for Free and Open-Source Software. FOSS is also a movement of sorts that's taken hold since the earlier days of computing with people like Richard Stallman, who spearheaded the GNU initiative and has been very active in promoting FOSS throughout his life. With the advent of FOSS programming languages and FOSS operating systems (such as GNU/Linux and FreeBSD), this movement grew and is now quite established across various fields that involve programming. As you can imagine, FOSS is also quite relevant in data science and A.I., at least lately. Most data scientists and A.I. professionals today tend to use an open-source language (many of them using Python, while the more adventurous dabble with Julia, Scala, and lately even Rust), handle open-source dataset (such as those made freely available at the UCI Machine Learning repository, among many other sites), and work with open-source frameworks (such as Scikit-learn, MXNet, and Flow). It's doubtful that many people get into data science with any monetary investment in the tools or the datasets they need since it's a far better investment to spend money on educational resources such as books and videos marketed by a technical publisher. Interestingly, these resources have more in common with FOSS than all that mediocre stuff you find on YouTube these days, labeled as educational for some reason. FOSS in data science (and A.I. to a great extent) is largely responsible for the immense growth of this field. While back in the old days when I was doing my Ph.D. the best way to get into analytics, particularly machine learning, was through platforms like Matlab that come with a relatively high price tag, nowadays you can start your data science journey without spending any money on the software you use. This way, you can develop some skills and try out the field before deciding to stick with it. Since there are more reasons to commit to data science than not to, the easy point of entry made data science popular, while the trend is also bound to continue. Nevertheless, it's important to note some exceptions to the FOSS paradigm, which are also relevant in data science. First of all, there is Mathematica, which is probably one of the best closed-source platforms out there, not just for data science but for any field that involves numeric data. Contrary to what its name suggests, Mathematica is a broad kind of platform having its own programming language built-in; it's not just about Math. Also, its latest version feature A.I. tools, while the person behind this piece of software is a genius scientist who also came up with a novel model for describing the universe. Apart from Mathematica, there is also Matlab, which is still used by made learners of the craft, particularly in academia. Lately, however, its popularity has started to decline, partly because of its open-source clone, Octave, and partly because it pales when compared with modern data science and A.I. platforms that feature better performance and larger communities of users. All in all, FOSS is paramount in data science work, partly due to the relevance of programming in this field. While new FOSS players come to our field (the most notable of which is Rust, which I covered briefly in the previous article on this blog), chances are that some of them are bound to stay. Things like the Jupyter notebook, for example, aren't going to disappear, even if other code notebooks have entered the scene lately, especially when it comes to the Julia language. In any case, if you want to learn more about the various (mostly open-source) software that populates our fascinating field, you can check out my book Data Science Mindset, Methodologies, and Misconceptions. As a bonus, you can also learn about other aspects of the data science field, such as the marvelous methodologies it features, without getting all too mathy about it! It's been a few years since I authored it, but so far, it's aged quite well, just like most FOSS out there we use in data science and A.I. work. Cheers!  A-B testing plays a crucial role in traditional science as well as data science. It isn't easy to imagine a scientific experiment worth its time without A-B testing. It's such a useful technique that it features heavily in data analytics too. In this article, we'll explore this essential method of data analysis, focusing on its role in scientific work and data science. In a nutshell, A-B testing uses data analysis to determine if two different samples are significantly different from each other, concerning a given variable. The latter is usually a continuous variable, used to examine how different the two samples are (it can be nominal too, however). The two samples often derive from a partitioning of a dataset based on another variable, which is binary. A-B testing is closely linked to Statistics, although any heuristic could be used to evaluate the difference between the two samples. Still, since Statistics yields a measurable and easy-to-interpret result in the form of a probability (p-value), it's often the case that particular statistical tests are used for A-B testing. A-B testing is used heavily in scientific work. The reason is simple: since there are several hypotheses the analyst considers, it's often the case that the best way to test many of these hypotheses is through A-B testing. After all, this methodology is closely linked to the formation of a hypothesis and its testing, based on the data at hand. Naturally, the usefulness of A-B testing is also apparent in data science and data analytics during the data exploration stage. The statistical tests used for A-B testing are t-tests, chi-square tests, and to a lower extent, z-tests. The t-test handles cases where a continuous variable is involved (e.g., Sales), while the chi-square one is geared towards nominal variables. Z-tests are very much like t-tests, but they are less powerful and make stronger assumptions about the data. All statistical tests yield a p-value as a result, which is compared to a predefined threshold (alpha), taking values like 0.05, 0.01, or 0.001. The lower the p-value, the more significant the result. Having a p-value lower than the alpha value means that you can safely disprove the Null Hypothesis (which states that any differences between the two samples are due to chance). Note that A-B testing is a deep topic, and it's hard to do it justice in a blog article. Also, it requires a lot of practice to understand it thoroughly. So, if it sounds a bit abstract, that's normal, especially if you are new to Statistics. Cheers!  The data scientist and the data analyst both deal with data analysis as their primary task, yet those two roles differ enough to warrant an entirely different set of expectations for each. Both share common attributes and skills, however, making them more similar than people think. This similarity allows a relatively more straightforward transition from one role to another, if needed, something not everyone realizes. This article explores this situation's details and makes some suggestions as to how each role can benefit the other. The two roles are surprisingly similar, in ways going beyond the surface kinship (i.e., data analysis). Data scientists and data analysts deal with all kinds of data (even though text data is not standard among data analysts), often directly from databases. So, they both deal with SQL (or some SQL-like language) to access a database and obtain the data needed for the project at hand. Both kinds of professionals deal with cleaning and formatting the data to some extent, be it in a programming language (e.g., Python or Julia), or some specialized software (e.g., a Spreadsheet program, in the case of data analysts). Also, both data scientists and data analysts deal with visuals and presentations containing these graphics. Finally, both kinds of professionals write reports or some form of documentation for their work and share it with the project's appropriate stakeholders. Despite the sophistication of our field, we can learn some things from data analysts as data scientists. Particularly the new generation of data scientists, coming out of bootcamps or from a programming background, have a lot to benefit from these professionals. Namely, the data analysts are closer to the business side of things and often have domain knowledge that data scientists don't. After all, data analysts are more versatile as professionals in employability, making them more prone to gathering experience in different domains. Also, data analysts tend to have more developed soft skills, particularly communication, as they have more opportunities to hone them. Learning all that can benefit any data scientist, especially those who are new to the field. Additionally, data analysts can learn from data science professionals too. Specifically, the value of an in-depth analysis that we do as data scientists are something every analyst can benefit from undoubtedly. In particular, data engineering is the kind of work that adds a lot of value in data science projects (when it's done right) and something we don't see that much in data analytics ones. What's more, predictive modeling (e.g., using modern frameworks, such as machine learning) is found only in data science, yet something a data analyst can apply. Once someone has the right mindset (aka the data science mindset), it's not too difficult to pick up those skills, particularly if they are already versed in data analytics. If you wish to learn more about the soft skills and business-related aspects of data science, you can check out one of my relatively recent books, Data Scientist Bedside Manner. In this book, my co-author and I look into the organization hiring data scientist, the relevant expectations, and how such a professional can work effectively and efficiently within an organization. So, check it out if you haven't already. Cheers!  Robotic Process Automation, or RPA for short, is a methodology involving the automation of specific data-related processes through specialized scripts. RPA usually applies to low-level monotonous, and easy-to automate tasks, though lately, it has escalated into other tasks that are more high-level. RPA is quite popular for saving money, but it has its perils when it is in excess. Whatever the case, it dramatically impacts our field, so it's essential to know about it. This article is all about that.
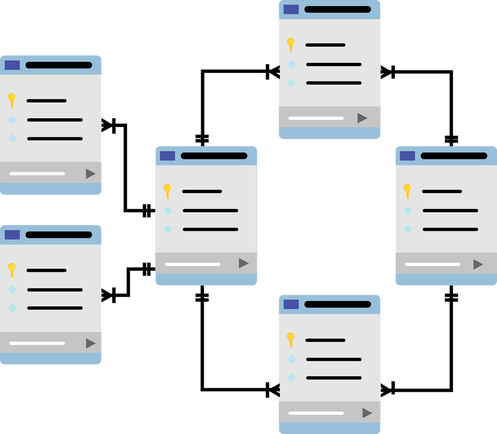
Let's start by looking at the usefulness of RPA. RPA is useful in the extract, transform, and load (ETL) operations of all kinds. This kind of work involves moving the data from A to B, making changes to it, and making it available to other project stakeholders. Even in data science, there is a lot of ETL work involved, and often the data scientist is expected to undertake it. Naturally, RPA in ETL is very useful as it saves us time, time which we can spend on more challenging tasks, such as picking, training, and refining a model. Also, many data engineering tasks require a lot of time, so if they can be automated to some extent through RPA, it can make the whole project more efficient. The danger of RPA when in excess becomes apparent when we try to automate the whole data science pipeline or even just individual parts of it. Take data engineering, for example. If we were to automate the whole thing, we'd be left with no say in what variables are worth looking into and what the data has to tell us. All initiatives from the data scientist would be gone, and the whole project would be mechanical and even meaningless. Some insights might still come about, but the project wouldn't be as powerful. The same goes for other parts of the data science workflow. RPA is used in specialized frameworks for data modeling, the part of the pipeline that follows after data engineering. Systems like AutoML, for example, attempt to apply RPA in data modeling through various machine learning models. Although this may have some advantages over traditional approaches, in the long run, it may rob data scientists of their expertise and the personal touch of the models developed. After all, if everything becomes automated in data science, what's the point of having a human being at that role? Maybe certain occupations can be outsourced to machines, but it's not clear how outsourcing even the more high-level work to them will benefit the whole. The good news is that even though RPA can undertake many aspects of data science work, it cannot replicate the data science mindset. This frame of mind is in charge of how we work the data and why. It's what makes our work worth paying for and what brings about real value from it. You can learn more about the data science mindset and other aspects of data science work from my book Data Science Mindset, Methodologies, and Misconceptions. Feel free to check it out when you have some time. Cheers!  Not to be confused with graphics (visuals), graphs are a data structure used in data science work. This data analysis approach is quite popular today, yet it's not covered adequately in the data science literature. The fact that it's a fairly advanced topic may have something to do with that. In any case, graphs are a powerful tool as they capture information without worrying about dimensionality, which, although manageable in most cases, can be challenging to overcome in more complex problems. This article will explore graphs, the theory behind them, their applications, and how they are stored. Let's start by taking a look at graphs and the theory behind them. First of all, a graph is a representation of information in the form of a graphical structure consisting of nodes and arcs. Nodes represent entities of interest (e.g., people in a social media network), and arcs are the connections among these entities (e.g., an online friendship between them). The nodes and the arcs may have additional metadata attached to them, such as attributes (name of that person, date of birth, the duration of each friendship connection, etc.). The attribute that depicts the "strength" or "length" of an arc is referred to as its weight, and it's crucial for various graph algorithms. So, a graph can formally represent the relationships of a set of entities, along with any supplementary information involved. The mathematical framework of graphs and a series of useful theorems and heuristics are referred to as Graph Theory. Graphs have lots of useful applications in data science work. When they are used for data analysis, they go by the term Graph Analytics. This kind of analytics is an integral part of data science, although it's not always essential for the average data science project. For example, if you care about analyzing a complicated situation, like the logistics of an organization, graphs may come in very handy. However, if you care about predicting the next quarter's sales, graphs may be overkill, plus the problem would be more easily solved through a time series regression model. Also, for problems involving lots of dimensions, graphs can be handy because they can model the data points' relationships through a similarity metric that they can use as the set of weights of the various arcs in a graph. But where do we store these elaborate data structures? Fortunately, there are specialized databases for this task, aka graph databases. This kind of data storage and retrieval system allows for efficient encoding of the graphs and some useful operations with them. Neo4j is a popular such database, as well as a graph visualization tool. However, there are others more refined that are also able to manage enormous datasets. Most modern graph databases today are NoSQL databases that can handle other kinds of datasets, not just graph-based ones. A well-known such database is ArangoDB. If you are interested in learning more about this and other useful data science methodologies, check out my book Data Science Mindset, Methodologies, and Misconceptions. In this manuscript, I delve into all kinds of methodologies related to data science work, including graphs and NoSQL databases. However, the focus is on the data science mindset, which is essential for any data scientist as well as remaining relevant in this field. Check it out when you have a moment. Cheers!  Data analytics and data science are both about finding useful (preferably actionable) insights in the data and helping with the decisions involved. In data science, this usually involves predictive models, usually in the form of data products, while the analysis involved is more in-depth and entails more sophisticated methods. But what tools do data analysts and data scientists use? First of all, we need to examine the essential tasks that these data professionals undertake. For starters, they usually gather data from various sources and organize it into a dataset. This task is usually followed by the task of cleaning it up to some extent. Data cleaning often involves handling missing values and ensuring that the data has some structure to it afterward. Another task involves exploring the dataset and figuring out which variables are the most useful. Of course, this depends on the objective, which is why data exploration often involves some creativity. The most important task, however, is building a model and doing something useful with the data. Finally, creating interesting plots is another task that is useful throughout the data analyst/scientist's workflow. You can do all the tasks mentioned earlier using a variety of tools. More specifically, for all data acquisition tasks, a SQL piece of software is used (e.g., PostgreSQL). This sort of software makes use of the SQL language for accessing and querying structured databases so that the most relevant data is gathered. For data science work, NoSQL databases are also often used, along with their corresponding software. As for all the data analytics tasks, a program like MS Excel is used by all data analysts, while a programming language like Python or Julia by all the data scientists. Data analysts use Tableau or some similar application for data visualization tasks, while data scientists employ a graphics library or two in the programming language they use. For all other tasks (e.g., putting things together), both kinds of data professionals use a programming language like Python/Julia. Naturally, all of the tools mentioned previously have evolved and continue to evolve. The fundamental functionality may remain about the same, but new features and changes to the existing features are commonplace. For example, new libraries are coming about in programming languages, expanding the usefulness of the languages while creating more auxiliary tools for various data-related tasks. No matter how these tools evolve, the one thing that doesn't change is the mindset behind all the data analytics/science work. This mindset is the driving force of all such work and the ability to use whatever tools you have at your disposal to make something useful for the data at hand. The mindset is closely related to a solid understanding of the methodologies involved in data analytics/science. For more information on this subject, particularly the mindset part, check out my book “data science mindset, methodologies, and misconceptions.” In it, I cover this topic in sufficient depth, and even if it is geared towards data science professionals, it can be useful to data analysts and other data professionals also. Cheers! |
Zacharias Voulgaris, PhDPassionate data scientist with a foxy approach to technology, particularly related to A.I. Archives
December 2022
Categories
All
|
||
 RSS Feed