|
As you may already know, Julia is a functional programming language geared towards scientific computing. It is particularly useful in data science nowadays as there are many specialized libraries for this. Simultaneously, it's a fast and easy-to-work-with language, enabling you to create useful scripts for data science tasks quickly. Additionally, it's similar to Python while there are bridge packages for the two languages, making it possible to jump from one to another, leveraging code from both languages in your data science projects.
As for machine learning, this is the part of data science that deals with the creation, refining, and deployment of specialized data models, based on the data-driven approach to data analytics. It involves systems like K-means (for clustering), Support Vector Machines (for predictive analytics), and various heuristics (for specific tasks such as feature evaluation) to facilitate all kinds of data science work. Much like Statistics, it is versatile, though contrary to Stats, it doesn't rely on probabilistic reasoning and distributions for analyzing the data. That's not to say that you need to pick between the two frameworks, however. A good data scientist uses both for her work. Julia and machine learning are a match made in heaven. Not only does Julia offer direct support for machine learning tasks (e.g., through its various packages), but it also makes it easy for a data scientist (having just basic training in the language) to write high-performance scripts for processing the data at hand. You can even use Julia just for your data engineering tasks if you are already vested in another programming language for your data models. So, it's not an "either-or" kind of choice, but more of an add-on situation. Julia can be the add-on, though once you get familiar with it, you may want to translate your whole codebase in this language for the extra performance it offers. This prediction isn't some optimistic speculation, by the way. Julia has been evolving for the past few years at a growing rate, even though other programming languages have also been coming about. Furthermore, it has the backing of a prestigious university (MIT), while there is a worldwide community of users and Julia-specific events, such as JuliaCon, happening regularly. So, if this trend continuous, Julia is bound to remain relevant for the years to come, expanding in functionality and application areas. Naturally, if machine learning continues on its current trajectory, it will also stick around for the foreseeable future. If you want to learn more about Julia and machine learning, especially from a practical perspective, please check out my book Julia for Machine Learning, published in the Spring of 2020. There, you can learn more about the language, explore how it's useful in machine learning, learn more about what machine learning entails and how it ties in the data science pipeline, and experiment with various heuristics not so well known (some of them are entirely original and come with the corresponding Julia code). So, check this book out when you have the chance. Cheers!
0 Comments
 A data scientist A.I. is an A.I. system that can undertake data science work end-to-end. Systems like AutoML are in this category and it seems that the trend isn’t going to go away any time soon. After all, a data scientist A.I. is better value for money and a solution that can scale very well. Amazon, for example, makes use of such systems to ensure that you view a personalized page based on your shopping and viewing history on the well-known e-commerce website. But how feasible is all this for those not having Amazon’s immense resources? Well, A.I. systems like this are already available to some extent with the only thing missing is data. There are even people in data science who - in lack of another way to describe them - are short-sighted enough to implement them, effectively irreversibly destroying our field. So, once a critical mass of users have enough data to get such a system working well, the question of feasibility would give way to things like "how profitable is it?" or "will it be able to handle the work of other data professionals too?" What about responsibility and liability matters though? Well, A.I. systems may do a great many things but taking responsibility is not one of them. As for when things get awry and there are legal issues, they cannot be held liable. As for the companies that developed them, well, they couldn’t care less. So, if you are using an A.I. system as a data scientist, you are effectively shouldering all the responsibility yourself, all while insulating yourself from any intervention capabilities. In other words, you need to trust the damn thing to do its job right, all while the data you give it may be biased in various ways, something no A.I. system has managed to handle yet. So, what’s the bottom line in all this? Well, A.I. systems may undertake a lot of data science work successfully, but they cannot (at least at this time) be data scientists, no matter what the companies behind these systems promise. There is no doubt that A.I. is a useful tool in data science work, but you still need a human being, particularly one with some understanding of how an organization works, to be held responsible for the data science projects. Even if A.I. is leveraged in these projects at least there is someone to answer for the results, particularly if there are privacy violations or biases involved. If you want to learn more about data science and AI’s role in it, feel free to check out the AI for Data Science book I’ve co-authored a couple of years ago. This book, published by Technics Publications, covers a series of AI-related methodologies related to data science, such as deep learning, as well as others that are more generic, such as optimization. The book is supplemented by Jupyter notebooks in Python and Julia and lots of examples. Check it out when you have a moment!  Nowadays, many people think that data science is as simple as most of its evangelists claim, so they end up making some avoidable mistakes in their work. Every data-related profession needs focus and attention, even more so if it involves complex problems as data science does. In this article, we'll explore some of the most common mistakes data scientists make in their day-to-day work and some suggestions as to how you can remedy them. If this article is popular, I may write another one on this topic, exploring additional mistakes data scientists make. First of all, many data scientists carry the illusion that the world is like Kaggle competitions, where the data is relatively clean and tidy. Simultaneously, the only thing that matters is a performance metric, such as accuracy or mean squared error. Although there is merit in practice through such a competition, data science projects involve much more when you are learning about data models. So, paying attention to data engineering, mainly data cleaning and data exploration, is vital for data science work. Additionally, communicating your findings through a report/presentation and comments or any other text accompanying your code is crucial. Another mistake many data scientists make is using models without understanding them enough. This superficial knowledge is especially the case with machine learning models, particularly AI-based ones (i.e., various artificial neural networks). Of course, the libraries at your disposal will do most of the weight-lifting, but you still need to know what they are doing, how the various hyper-parameters come into play, and what the outputs mean. Having a solid understanding of how they work under the hood can also be helpful, as it can make troubleshooting more straightforward and more efficient. So, for best results, learn about the models' theory, maybe even code one from scratch yourself, and use them properly. Moreover, many data scientists don't understand the business side of things as they focus too much on the field's coding and math aspects. As a result, they don't always solve the problems they need to solve since they misinterpret the data project's requirements. This miscommunication or misaction is particularly severe as a mistake if the project has a tight deadline, since revisions may be grossly limited. So, instead of just looking at the technical aspects of data science, you can learn to "speak the business language" better and set more accurate goals for your data science project and corresponding tasks. This refined communication is a valuable transferable skill, by the way. Finally, going through the motions as if it's a mechanical process, void of curiosity and creativity, can be a deadly mistake. It's not that it will kill you, but it will make the whole experience in the data science field lifeless and uninteresting. It's hard to build a career in it under these circumstances. The mistake is more like a symptom of a deeper problem, namely shallow learning of the field, particularly the mindset. If you view things in data science mechanically, you probably didn't understand it well enough to appreciate it and, to some extent, feel inspired by it. Remedying this mistake involves going into depth in its various methodologies and cultivating a genuine interest in it, starting with a real curiosity about it. Although not a panacea, learning more about data science and the right mindset behind it can help alleviate most of the mistakes commonly made by data scientists. This knowledge and know-how can also help you lay strong foundations for your data science work and enable you to develop your skill-set effectively and efficiently. So, check out my book "Data Science Mindset, Methodologies, and Misconceptions" and spread the word about it if you are so inclined. Cheers!
Nowadays, there is a lot of confusion between the fields of Statistics and Machine Learning, which often hinders the development of the data science mindset. This is especially the case when it comes to innovation since this confusion can often lead someone to severe misconceptions about what's possible and the value of the data-driven paradigm. This article will look into this topic and explore how you can add value through a clearer understanding of it. First of all, let's look at what statistics is. As you may recall, statistics is the sub-field that deals with data from a probabilistic standpoint. It involves building and using the mathematical models that describe how the data is distributed (distributions) and figuring out the likelihood of data points being part of these distributions through these functions. Many heuristics are used, though they are called statistic metrics or just statistics, and the whole field is generally very formalist. When data behaves as expected and when there is an abundance of it, statistics works fine, while it also yields predictive models that are transparent and easy to interpret or explain. Now, what about machine learning? Well, this is a field of data analytics that involves an alternative approach to handling data, one that's more data-driven. In other words, machine learning involves analyzing the data without any ad-hoc notions about it, in the form of distributions or any other mathematical frameworks. That's not to say that machine learning doesn't involve math, far from it! However, the math in this field is used to analyze the data through heuristic-based and rule-based models, rather than probabilistic ones. Also, machine learning ties in very well with artificial intelligence (A.I.), so much so that they are often conflated. A.I. has a vital role in machine learning today, so the AI-based models often dominate in this field. As you may have figured out by now, the critical difference between statistics and machine learning lies in the fact that statistics makes assumptions about the data (through the distribution functions, for example) while machine learning doesn't. This difference is an important one that makes all the difference (no pun intended) in the models' performance. After all, when data is complex and noisy, machine learning models tend to have better performance and generalize better. Perhaps that's why they are the most popular option in data science projects these days. You can learn more about the topic by checking out my latest book, which covers machine learning from a practical and grounded perspective. Although the book focuses on how you can leverage Julia for machine learning work, it also covers some theoretical concepts (including this topic, in more depth). This way, it can help you cultivate the right mindset for data science and broaden your perspective on the data science field. So, check it out when you have a moment!  Cloud computing has taken the world by storm lately, as it effectively democratized computing power and storage. This has inevitably impacted data science work too, especially when it comes to the deployment stage of the pipeline. Two of the most popular methods for accomplishing this is through containers and micro-services, both enabling your programs to run on some server somewhere with minimal overhead. The value of this technology is immense. Apart from the cost-saving that derives from the overhead reduction, it makes the whole process easier and faster. Getting acquainted with a container program like Docker isn't more challenging than any other software a data scientist uses, while there are lots of docker images available for the vast majority of applications (including a variety of open-source OSes). Cloud computing in general is quite accessible, especially if you consider the options companies like Amazon offer. The key value-add of all this is that a data scientist can now deploy a model or system as an application or an API on the cloud, where it can live as long as necessary, without burdening your coworkers or the company’s servers. Also, through this deployment method, you can scale up your program as needed, without having to worry about computational bandwidth and other such limitations. Cloud computing can also be quite useful when it comes to storage. Many databases nowadays are available on the cloud, since it's much easier to store and maintain data there, while most cloud storage places have quite a decent level of cybersecurity. Also, having the data live on the cloud makes it easier to share it with the aforementioned data products deployed as Docker images, for example. In any case, such solutions are more appealing for companies today since not many of them can afford to have their own data center or any other in-house solutions. Of course, all this is the situation today. How are things going to fare in the years to come? Given that data science projects may span for a long time (particularly if they are successful), it makes sense to think about this thoroughly before investing in it. Considering that more and more people are working remotely these days (either from home due to COVID-19, or from a remote location because of a lifestyle choice), it makes sense that cloud computing is bound to remain popular. Also, as most cloud-based solutions become available (e.g. Kubernetes), this trend is bound to continue and even expand in the foreseeable future. Hopefully, it has become clear from all this that there are several angles to a data science project, beyond data wrangling and modeling. Unfortunately, not many people in our field try to explain this aspect of our work in a manner that's comprehensible and thorough enough. Fortunately, a fellow data scientist and I have attempted to cover this gap through one of our books: Data Scientist Bedside Manner. In it, we talk about all these topics and outline how a data science project can come into fruition. Feel free to check it out. Cheers!  Every data set is a multi-dimensional structure, a crystallization of information. As such, it can best be described through mathematics, particularly Geometry (the science of measuring Earth and the foundation of many scientific fields, such as Physics). You may have a different perspective about Geometry, based on your high school education, but let me tell you this: the field of Geometry is much more than theorems and diagrams, which although essential, are but the backbone of this fascinating field. However, Geometry is not just theoretical but also very practical. The fact that it applies to the data we deal with in data science attests to that. When it comes to Geometry in data science, a couple of metrics come to mind. Namely, there is the Index of Discernibility (ID) and Density (there is also an optimizer I've developed called DCO, short for Divide and Conquer Optimizer, but it doesn't scale beyond 5 dimensions so I won't talk about it in this article). Both of these metrics are useful in assessing the feature space and aiding various data engineering tasks, such as feature selection (ID can be used for evaluating features) and data generation (through the accurate assessment of the dataset's "hot spots"). Also, both work with either hyperspheres (spheres in the multidimensional space) or hyper-rectangles. The latter is a more efficient way of handling hyperspaces so it's sometimes preferable. Metrics like the ones mentioned previously have a lot to offer in data science and A.I. In particular, they are useful in evaluating features in classification problems and the data space in general (in the case of density). Naturally, they are very useful in exploratory data analysis (EDA) as well as other aspects of data engineering. Although ID is geared towards classification, Density is more flexible than that since it doesn't require a target variable at all. Note that Density is largely misunderstood since many people view it as a probability-related metric, which is not the case. Neither ID nor Density has anything to do with Statistics, even if the latter has its own set of useful metrics. Beyond the aforementioned points, there are several more things that are worth pondering upon when it comes to geometry-based metrics. Specifically, visualization is key in understanding the data at hand and whenever possible, it's good to combine it with geometry-based metrics like ID and Density. The idea is that you view the data set both as a collage of data points mapped on a grid as well as a set of entities with certain characteristics. The ID score and the density value are a couple of such characteristics. In any case, it's good to remember that geometry-based metrics like these can be useful when used intelligently since there is no metric out there that's a panacea for data science tasks. So what's next? What can you do to put all this into practice? First of all, you can learn more about the Index of Discernibility and other heuristic metrics in my latest book, Julia for Machine Learning (Technics Publications). Also, you can experiment with it and see how you can employ it in your data science projects. For the more adventurous of you, there is also the option of coming up with your own geometry-based metrics to augment your data science work. Cheers! As most of you probably know, Apache Spark is a big data platform (a data governance system), geared towards large-scale data. Employing HDFS (Hadoop Distributed File System), it handles data on a computer cluster (or a cloud), processing it and even building some basic predictive models with it (including Graph-based ones). Written in Scala, it is compatible with two more programming language: Java and Python. However, most people use it simply because it’s much faster than Hadoop, up to 100 times faster, while it offers a more intuitive and versatile toolbox to its users. Spark fills a unique need in data science: handling big data quickly, in an integrated ecosystem. If you also know Scala, that’s a big plus because you can write your own scripts to execute in this ecosystem, without having to rely on other data professionals. Also, Spark has a large enough community and resources, making it a safe option for data science work, while there are companies like DataBricks which are committed to maintaining it and evolving it. The fact that there is even a conference on Spark (and AI) by the aforementioned company adds to that. OK, but what about Spark alternatives? After all, Spark can’t be the only piece of software that does this set of tasks well, right? Well, there is also Apache Storm, a big data tool created by Twitter. One advantage it has over Apache Spark is that it can run on any programming language. Also, it’s fault-tolerant and fairly easy to use. What’s more, there is IBM Infosphere Streams, which specializes in stream processing. Also, the fact that it has an IDE based on the Eclipse one, makes it easier to work with. Although Storm is fast, this one is even faster, while it can also fuse multiple streams together. This can aid your analysis in terms of insights made available. This big data tool works with the Streams Processing Language (SPL) and comes with several auxiliary programs for monitoring and more effective administration. Additionally, there is Apache Flink, another high-speed and fault-tolerant alternative to Spark (like Apache Storm). Naturally, it’s compatible with a variety of similar tools, like Storm as well as Hadoop’s MapReduce. Because of its design, which focuses on a variety of optimizations and the use of iterative transformations, it’s a great low-latency alternative to Spark. Finally, there is TIBCO StreamBase, which is designed with real-time data analytics in mind. The niche of this software is that it creates a live data mart communicating with the users through push notifications. Then, they can analyze and create visuals of the data interactively StreamBase appeals also to non-data scientist, through its LiteView Desktop version. Beyond these four alternatives to Apache Spark there exist several ones which are beyond the scope of this article. The idea here is to show that there are other tools out there for this sort of data governance tasks, some of which can be even better than Spark. In any case, it's good to be aware of what's out there and develop a mindset that is not tied to specific software for the tasks at hand. More about all this in my book Data Science Mindset, Methodologies, and Misconceptions, which I authored a few years back, yet it remains relevant to this day. Check it out when you have a moment. Cheers!  (the lady in the picture is a metaphor for the "feature" or "set of features" in the dataset at hand)
If data science, a feature is a variable that has been cleaned and processed so that it's ready to use in a model. Most data models are sensitive to their inputs' scale, so most features are normalized before they are useful in these models. Naturally, not all features add value to a model or a data science project in general. That's why we often need to evaluate them, in various ways, before we can proceed with them in our project. Evaluating features is an often essential part of the data engineering phase in the data science pipeline. It involves comparing them with the target variable in a meaningful way to assess how well they can predict it. This assessment can be done by either evaluating the features individually or in combination. Of these approaches, the first one is more scalable and more manageable to perform. Since there are inevitable correlations among the features, the individual approach may not paint the right picture, since two "good" features may not work well together since they depict the same information. That's why evaluating a group of features is often better, even if it's not always practical. Note that the usefulness of a feature usually depends on the problem at hand. So, we need to be clear as to what we are trying to predict. Also, even though a good feature is bound to be useful in all the data models involved, it's not utilized the same way. So, having some intimate understanding of the models can be immensely useful for figuring out what features to use. What's more, the form of the feature is also essential in its value. If a continuous feature is used as is, its information is utilized differently than if it is binarized, for example. Sometimes, the latter is a good idea as we don't always care for all the information the feature may contain. However, it's best not to binarize continuous features haphazardly since that may limit the data models' performance. The methodology involved also plays a vital role in the feature evaluation. For example, if you perform classification, you need to assess your features differently than if you are performing regression. Also, note that features play a different role altogether when performing clustering as the target variable doesn't participate (or it's missing altogether). As a result of all this, evaluating features is crucial for dimensionality reduction, a methodology closely linked to it and usually follows it. You can learn more about features and their use in predictive models in my latest book, Julia for Machine Learning. This book explores the value of data from a machine learning perspective, with hands-on application of this know-how on various data science projects. Feature evaluation is one aspect of all this, which I describe through the use of specialized heuristics. Check out this book when you have a chance and learn more about this essential subject!  As we talked about in the previous article, open-mindedness is our ability to view things from a wider perspective, with as few assumptions as humanly possible. We saw how this concept is relevant and useful in a data science project. But how does open-mindedness benefit A.I. in practice? Just like in the data science case, learning A.I. also stands to benefit from open-mindedness. This is quite obvious, considering how mediocre a job most of the educators of A.I. do and the number of con artists in this field. Keeping an open mind about A.I. and learning it properly are essential for becoming a good A.I. practitioner, particularly one who can see beyond ANNs. After all, there is much more to A.I. than this graph-based family of systems and no matter how good these are, there are always other things to learn such as AI-based optimization methods and Fuzzy Logic systems. Researching A.I. is probably that case where open-mindedness not only shines but it’s also more or less essential. This is something harder and harder to do since everything in the A.I. research space seems to be geared towards either ANNs or NLP (usually ANN-based). It’s quite rare to find any originality in the A.I. research these days, though a lot of the stochastic optimization systems (which are AI-based optimizers) have some pretty good ideas behind them. Also, some AI-based dimensionality reduction methods are quite interesting too. Open-mindedness can also be applied when exploring the limits of an A.I. system. This is particularly important in a project since it’s easy to get stuck with the impression that an A.I. system is the best choice, even if it isn’t. Open-mindedness allows you to view other options and consider the limitations of an A.I. system more realistically, making more pragmatic choices. Finally, open-mindedness as an attitude can help us have a more humble view of things when it comes to A.I. After all, this is a fairly new field (compared to data analytics, for example) and has a lot of room for improvement, something many A.I. practitioners tend to forget. Perhaps that's why many such practitioners are still comparing A.I. models with Stats one (the equivalent of comparing a sports car with a toy car), instead of looking at the various non-AI-based machine learning options, which can be viable alternatives to the project at hand. In any case, you can learn more about A.I. from an open-minded perspective through a book I have co-authored a couple of years ago. Namely, the AI for Data Science book from Technics Publications covers this subject and provides a variety of stimuli for researching it properly. Although the term open-mindedness is not used per se in this book, it does delve into the way of thinking of an AI-oriented data scientist. So, check it out when you have the chance. Cheers!  Dimensionality reduction is the methodology involving the coding of a dataset's information into a new one consisting of a smaller number of features. This approach tries to address the curse of dimensionality, which involves the difficulty of handling data that comprises too many variables. This article will explore a primary taxonomy of dimensionality reduction and how this methodology ties into other aspects of data science work, particularly machine learning. There are several types of dimensionality reduction out there. You can split them into two general categories: methods involving the feature data in combination with the target variable, and methods involving the feature data only. Additionally, the second category methods can be split into those involving projection techniques (e.g., PCA, ICA, LDA, Factor Analysis, etc.), and those based on machine learning algorithms (e.g., Isomap, Self-organizing maps, Autoencoders, etc.). You can see a diagram of this classification below. 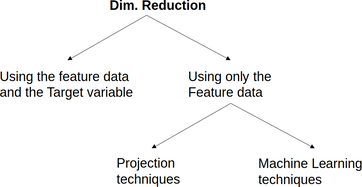 The most noteworthy dimensionality reduction methods used today are Principle Components Analysis (PCA), Uniform Manifold Approximation and Projection (UMAP), and Autoencoders. However, in cases where the target variable is used, feature selection is a great alternative. Note that you can always combine different dimensionality reduction methods for even better results. This strategy works particularly well when the methods come from different families. It's important to remember that dimensionality reduction is not always required, no matter how powerful it is as a methodology. Sometimes the original features are good enough, while the project requires a transparent model, something not always feasible when dimensionality reduction is involved. What's more, dimensionality reduction always involves some loss of information, so sometimes it's not a good idea. It's crucial to gauge all the pros and cons of applying such an approach before doing so, since it may sometimes not be worth it because of the compromises you have to make. Many of the datasets found in data science projects today involve variables that are somehow related to each other, though this correlation is a non-linear one. That's why many traditional dimensionality reduction methods may not be as good, especially if the datasets are complex. That's why machine learning methods are more prevalent in cases like this and why there is a lot of research in this area. What's more, these dimensionality reduction methods integrate well with other machine learning techniques (e.g., in the case of autoencoders). This fact makes them a useful addition to a data science pipeline. In my book Julia for Machine Learning, I dedicate a whole chapter in dimensionality reduction, focusing on these relatively advanced methods. Additionally, I cover other machine learning techniques, including several predictive models, heuristics, etc. So, if you want to learn more about this subject, check it out when you have the chance. Cheers! |
Zacharias Voulgaris, PhDPassionate data scientist with a foxy approach to technology, particularly related to A.I. Archives
December 2022
Categories
All
|


 RSS Feed