|
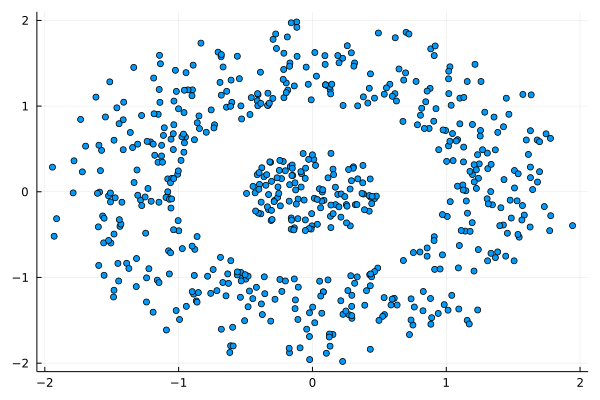
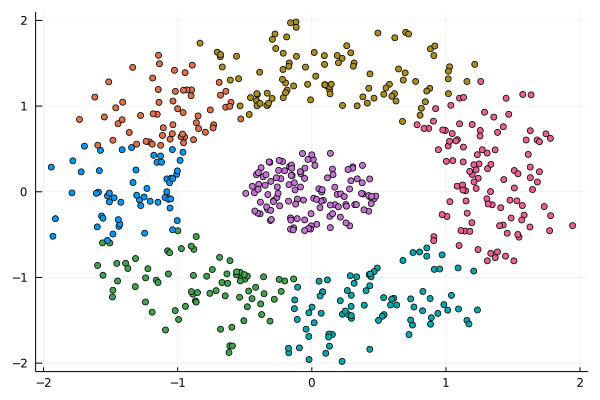
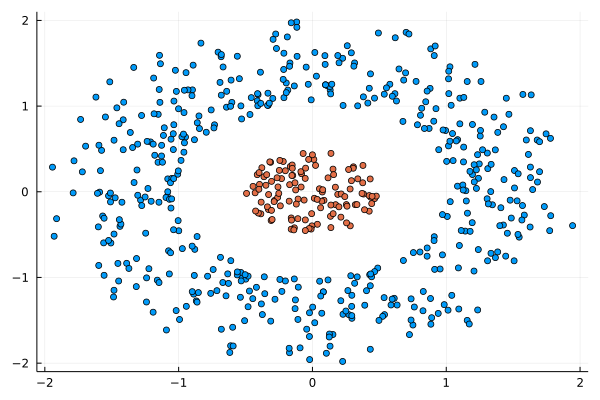
I was never into Clustering. My Ph.D. was in Classification, and later on, I explored Regression on my own. I delved into unsupervised learning too, mostly dimensionality reduction, for which I've written extensively (even published papers on it). For some reason, Clustering seemed like a solved problem, and as one of my supervisors in my Ph.D. was a Clustering expert (he had even written books on this subject) I figured that there isn't much for me to offer there. Then I started mentoring data science students and dug deeper into this topic. At one point, I reached out to some data scientists I'd befriended over the years asking them this same question. The best responses I got were that DBSCAN is mostly deterministic (though not exactly deterministic if you look under the hood) and that K-means (along with its powerful variant, K-means++) was lightweight and scalable. So, I decided to look into this matter anew and see if I could clean up some of the dust it has accumulated with my BROOM. Please note that when I started looking into this topic, I had no intention to show off my new framework nor to diminish anyone's work on this sub-fiend of data science. I have great respect for the people who have worked on Clustering algorithms, be it in research or their application-based work. With all that out of the way, let's delve into it. First of all, deterministic Clustering is possible even if many data scientists will have you believe otherwise. One could argue that any data science algorithm can be done deterministically though this wouldn't be an efficient approach. That's why stochastic algorithms are in use, particularly in challenging problems like Clustering. There is nothing wrong with that. It's just frustrating when you get a different result every time you run the algorithm and have to set a random seed to ensure that it doesn't change the next time you use that code notebook where it lives. So, deterministic is an option, just not a popular one. What about being lightweight? Well, if it's an algorithm that requires running a particular process again and again until it converges (like K-means), maybe it's lightweight, but probably not so much since it's time-consuming. Also, most algorithms worth their salt aren't as simple as K-means, which though super-efficient, leaves a lot to be desired. Let's not forget the assumptions it makes about the clusters and its reliance on distance, which tends to fail when several dimensions are present. So, in a multi-dimensional data space, K-means isn't a good option, and just like any other clustering algorithm, it struggles. DBSCAN struggles too, but for a different reason (density calculations aren't easy, and in multi-dimensional space, they are a real drag). So, where does that leave us? Well, this is quite a beast that we have to deal with (the combination of a deterministic process and it being lightweight), so we'll need a bigger boat! We'll need an enormous boat, one armed with the latest weapons we can muster. Since we don't have the computational power for that, we'll have to make do with what we have, something that none of the other brilliant Clustering experts had at their disposal: BROOM. This framework can handle data in ways previously thought impossible (or at least unfeasible). High dimensionality? Check. Advanced heuristics for similarity? Check. An algorithm that features higher complexity without being computationally complex? Check. But the key thing BROOM yields that many Clustering experts would kill for is the initial centroids. Granted that they are way more than we need, it's better than nothing and better than the guesswork K-means relies on due to its nature. In the toy dataset visualized above, I applied the optimal clustering method I've developed based on BROOM, there were two distinct groups in the dataset across the approximately 600 data points located on a Euclidean plane. Interestingly, their centers were almost the same, so K-means wouldn't have a chance to solve this problem, no matter how many pluses you put after its name. The initial centroids provided by BROOM were in the ballpark of 75, which is way too high. After the first phase of the algorithm, they were reduced to 7 (!) though even that number was too high for that dataset. After some refinement, which took place in the second phase of the algorithm, they were reduced to 2. The whole process took less than 0.4 seconds on my 5-year-old laptop. The outputs of that Clustering algorithm included the labels, the centroids, the indexes of the data points of each cluster, the number of data points in each cluster, and the number of clusters, all as separate variables. Naturally, every time the algorithm was run it yielded the same results since it's deterministic. Before we can generalize the conclusions that we can draw from this case study, we need to do further experimentation. Nevertheless, this is a step in the right direction and a very promising start. Hopefully, others will join me in this research and help bring Clustering the limelight it deserves, as a powerful data exploration methodology. Cheers!
0 Comments
OK, this title may sound a bit heavy, especially for this time of year. Let me break it down for you. There are various correlation metrics out there, which can handle two variables (let's call them x and y) and measure their relationship. More often than not, these metrics focus on the linear aspects of this relationship and are often confused by the non-linear ones. For example, a correlation metric like Pearson’s Correlation can tell you that a variable y defined as 2x + 5 is strongly correlated to x (a shocker, isn't it!) but if a variable z is defined as exp(x^2 + 1) were to be used instead, well Pearson's Correlation might struggle with that. A mathematician or even a Stats professional would assure you that there is a non-linear relationship between the two variables (x and z), but they'd have to rely on a plot of the two variables or some transformation of one of them (e.g., applying log() to z) if they were to measure this relationship. Things get even more complicated if the relationship is not as simple, e.g. that of x and a variable w defined as cos(x). Most likely, Pearson's correlation won't find anything there (a relationship close to 0), even though the Math or Stats professional mentioned previously would be sure there is a relationship there. So, what gives? Well, what gives is a big question that if I were to answer it here, it would shake your belief in Stats like a super quake, similar to that which brought San Francisco down over a century ago. Interestingly, most Stats concepts are from around that same time, perhaps a bit older than that. So, you've got to give those guys a break since they didn't know any better, plus they didn't have the tools we have at our disposal. Given the circumstances, they did a pretty good job at defining the metrics they did and weaving the fabric of a theory around their methods. Come to think about it, if modern mathematicians were like them, we'd be reasoning in high-dimensional terms now, instead of relying on these old-fashioned formulas and techniques. I propose a method based on the BROOM framework that looks into the non-linear and non-monotonous artifacts of a pair of variables to establish their relationship. This metric, which I call rbc (range-based correlation, as it's part of the ranges part of the framework), explores the two variables in an entirely data-driven manner, making no assumptions whatsoever about their distributions and their other aspects. As long as they are normalized, they are good to go. And this metric, contrary to all other correlation metrics I've tried, yields a correlation of 0.99 for the x-w pair and a similar figure for the x-z one. When you compare x with some random variable q (q belongs to the [0, 1] interval), it yields a weak correlation (usually between 0.1 and 0.2). As a result, we can deduce that it's a worthwhile metric for measuring the relationship between two variables, taking into account all non-linear artifacts while being unaffected by any lack of a monotonous pattern the two variables may exhibit. If you are interested in learning more, feel free to contact me. Cheers! |
Zacharias Voulgaris, PhDPassionate data scientist with a foxy approach to technology, particularly related to A.I. Archives
April 2024
Categories
All
|


 RSS Feed