 It's been over two years since the Compressed Data Format (CDF) made its debut, making storing data files in Julia a breeze. Not only does it handle various types of data easily, but it also allows for comments and any other stuff you'd like to include in your data file before sharing it with other Julia users. The native data file formats the language has been okay, but when it comes to larger datasets, they fall short. Also, conventional data file formats like CSV and JSON, although mature and easy to use, tend to be bulky as the number of data points/variables grows. CDF remedies all that by employing a powerful compression algorithm on the data at hand. The CDF script consists of a series of functions while it leverages another script for handling binary files. Because if you want to do anything meaningful with files, you need to go down to the 1s and 0s level. The conventional IO handling Julia offers is fine, but it's limited to text files mainly. However, the language has binary file capabilities, which are leveraged and simplified in the binfiles.jl script that CDF relies on for its IO operations. That script has just two functions, one for reading binary files and one for writing them. Naturally, everything on that level is expressed in Int8 vectors, as a data stream related to a binary file is a series of bytes, often in the form of an 8-bit number (ranging between -128 and 127, inclusive. So, if you wish to delve into this sort of file operation, make sure you familiarize yourself with this data structure. Fortunately, the CDF script is more high-level than the binfiles.jl one. Still, it needs to deal with binary files at one point, so it has to translate the data streams it handles into Int8 vectors. To make the most of the bandwidth your machine has, it breaks down the whole process into these distinct phases, which you can view in Fig. 1: 1. Turning the data into a Dict object if it's not in that form already. 2. Turning the dictionary into a text stream (string variable). 3. Compressing the text stream. 4. Passing the compressed data into the binary files function to read/write the corresponding files. 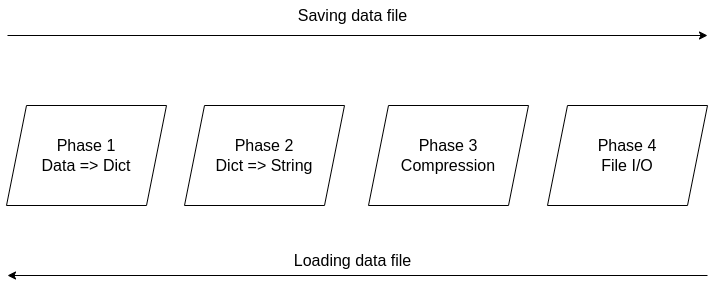 Figure 1. The four phases of the CDF file creation/loading process.
The handling of the binary files takes place using the binfiles.jl script, as mentioned previously, so we won't cover it in depth in this article. For the remaining phases, let's start from the easy part: compression (phase 3). Here the CodecZlib package is used, which contains a bunch of compression algorithms. The CDF script leverages the Deflate algorithm due to its speed and efficiency. Naturally, as everything is already in the form of a string variable by that stage utilizing the compression algorithm is pretty straightforward. Now the problem becomes turning everything into a string (phase 2). Although this seems straightforward, doing that all while ensuring that the whole process is easily reversible can be challenging. Fortunately, if everything is already in dictionary form, it's not that hard. After all, a dictionary comprises various keys which correspond to certain values, all of which can be retrieved through the keys() and values() functions of the dictionary class. So, handling a dictionary isn't that hard, and it can be done methodically. Of course, dumping the dictionary's contents into a string file isn't a great idea since the various key-value pairs need to be separated. One way to do this, which is also the way CDF is written, involves putting all the keys together in the beginning and then all the values corresponding to these keys. Each key is separated from the next using a space (the keys correspond to variable names, so they tend to be void of spaces). From that point on, for all pieces of data that need to be connected in that output string, a special character is used, one which doesn't come into play in data files. This way, it's easy to split the string between the keys and the values, using that special character as a separator. The same goes for all the different values that are added to the string. Since they might contain spaces in them, we use the special character to separate each from the next. Following that, we also store the types of these values so that we can reconstruct the original contents of the dictionary. The types are contained in a separate array and are separated by spaces. To make this information more easily accessible, we position it at the end of the string, separated from the values part using the special character. To create the dictionary (phase 1), we merely need to put the variable at hand into an empty dictionary, with the variable name as its key and its contents as its value (this is done automatically with the corresponding function of the CDF script). This process is a bit more cumbersome a process as it requires the user to input both the variable and its name, while it’s limited to a single variable (e.g., a matrix of a dataset). That’s why it’s generally better to have all the data available as a dictionary before using the CDF script. This way, if you need to add any comments to the data, you can do so by adding another key-value pair to the dictionary where the data lives. The data types supported by CDF at this stage are String, Char, Real, Float64, Int64, and Array of numbers of bits. In future versions of CDF, it may also be able to handle more complex scenarios, such as DataFrames, nested arrays, arrays of strings, etc. CDF can be useful for storing models too, with the (hyper)parameters being in a particular part of the dictionary, the operational conditions in another part and some metadata about the training data and the model's tested performance in another part. This way, by loading this CDF file, you can get all the relevant information about the model to use in your project.
0 Comments
 Unfortunately, datasets aren't as easy to gauge as the butterflies in this picture. Yet, even if the simpler cases where we can make a descriptive plot to highlight the geometry involved, similarity is not a binary matter. Two datasets may be somewhat similar or dissimilar, without being identical or in stark contrast. So, how could we gauge similarity in an N-dimensional space? The simplest thing to do is run a bunch of t-tests, one for each variable involved. This approach may be fine for someone new to the field (especially if the people managing this person's team aren't knowledgeable about these matters), but it won't work well. There are several underlying assumptions in this strategy that rob it of its validity and, possibly, its effectiveness. The Index of Congruence is a simple heuristic based on the Index of Peculiarity, which in turn is congruent to the Index of Discernibility (though not focused on classification scenarios per se). The Index of Congruence does one simple thing: gauge the similarity of two matrices of real numbers on a scale of 0 to 1 with high values denoting strong similarity. It's not perfect but it does what it sets out to do, and does so swiftly. If one of the datasets is larger than a given threshold, some (random) sampling takes place in both datasets, preserving the original ratio in sizes, before the heuristic is applied. Also, normalization takes place in the back-end without worrying the user, since we have better things to do than worry about the scale of the variables at hand, right? I could write about this heuristic for a while, but I'm sure you'd rather see it in action. So, I'm attaching a Jupyter notebook that you can check out on your own. No, I haven't switched to this kind of code notebook as I'm still in favor of Neptune notebooks, but when it comes to showcasing something, Jupyter notebooks remain the best option. Cheers!
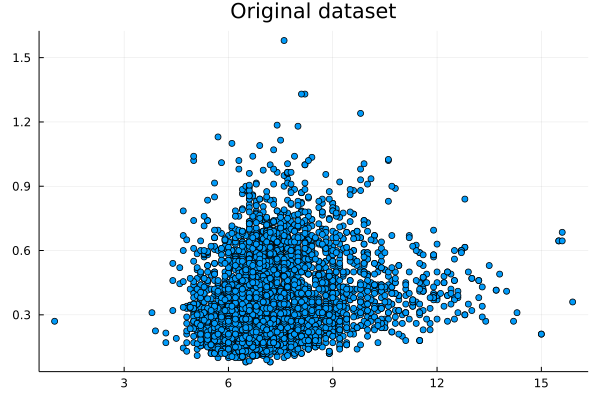
 I was never into Sampling techniques, even though I had to code a couple of them from scratch during my Ph.D. as there was no K-fold cross-validation method in Matlab at the time. Although nowadays it seems masochistic for me to code in Matlab, I am grateful for the experience. After all, the Julia language that I use regularly is very similar to Matlab in terms of syntax so this experience with Matlab coding made the learning of Julia easier and faster. Could it be possible that we could make data summarization easy and fast too, hopefully without resorting to any closed-source software like Matlab? This question has kept me wondering for a while now (perhaps more than I'm willing to admit!) partly because my data structures know-how wasn't there yet. Lately, however, I learned all about K-D trees, which are a more generalized form of binary search trees. I even published an article about it on the AIgents platform. In any case, K-D trees enable the quick finding of nearest neighbors as well as the filtering of data points within a given distance (I deliberately avoid saying hypersphere because if you've dealt with high-dimensional data as I've had, you probably detest that shape too!). In any case, finding points within a given distance (or radius if you are geometrically inclined) is necessary if you were to examine different areas of the dataset, particularly if you want to do that a lot. Since K-D trees make that easy and scalable, one can only wonder why no one ever thought about using them in data summarization yet. In simple terms, data summarization is representing the information of the original dataset with fewer data points (the fewer the better). Of course, you can do that using a centrality metric of your preference but summarizing a whole dataset, or even a variable, with one point creates more problems than it solves. It's this naive approach to data summarization that has brought about all the prejudices and discriminatory behavior over the years. Nassim Taleb is also very critical of all this and that's someone who has been around more and thought about things in more depth than most of us. Anyhow, data summarization is tricky and relatively slow. It's much easier to take a (hopefully random and unbiased) sample, right? Sure, but what if we don't want to take any chances and want to reduce the dataset optimally instead? Well, then we have no choice but to employ a data summarization method. The one I've developed recently, employing a couple of heuristics, does the trick relatively fast, plus it scales reasonably well (also, it's entirely automated, so there's no need to worry about normalization or the size of the summary dataset). Attached are the dataset I used (related to Portuguese wines) and a couple of plots, one for the first two variables of the dataset and one for the reduced version of that. The method works with K-dimensional data, but for the sake of demonstration, I only used two of them. For all this, along with a vector for the weights of the created data points, it took around 0.4 seconds on my 5-year-old machine. The reduction rate was about 65%, which is quite decent. For the whole dataset (all 13 variables) it took a bit longer: ~ 29 seconds, with a 54% reduction rate. Although the method seems promising, there are probably a few more optimizations that can be performed to it, to make it even more scalable. However, it’s a good start, particularly if you consider the new possibilities such a method offers. The one obvious one, which I’ve already explored, is data generation. The latter can be done independently from the data summarization part, but it works better if summarized data is used as an input. Another low-hanging fruit kind of application that's worth looking into is dimensionality reduction, based on the summarized dataset. All of these, however, is a story for another time. Cheers!
 I was never into Clustering. My Ph.D. was in Classification, and later on, I explored Regression on my own. I delved into unsupervised learning too, mostly dimensionality reduction, for which I've written extensively (even published papers on it). For some reason, Clustering seemed like a solved problem, and as one of my supervisors in my Ph.D. was a Clustering expert (he had even written books on this subject) I figured that there isn't much for me to offer there. Then I started mentoring data science students and dug deeper into this topic. At one point, I reached out to some data scientists I'd befriended over the years asking them this same question. The best responses I got were that DBSCAN is mostly deterministic (though not exactly deterministic if you look under the hood) and that K-means (along with its powerful variant, K-means++) was lightweight and scalable. So, I decided to look into this matter anew and see if I could clean up some of the dust it has accumulated with my BROOM. Please note that when I started looking into this topic, I had no intention to show off my new framework nor to diminish anyone's work on this sub-fiend of data science. I have great respect for the people who have worked on Clustering algorithms, be it in research or their application-based work. With all that out of the way, let's delve into it. First of all, deterministic Clustering is possible even if many data scientists will have you believe otherwise. One could argue that any data science algorithm can be done deterministically though this wouldn't be an efficient approach. That's why stochastic algorithms are in use, particularly in challenging problems like Clustering. There is nothing wrong with that. It's just frustrating when you get a different result every time you run the algorithm and have to set a random seed to ensure that it doesn't change the next time you use that code notebook where it lives. So, deterministic is an option, just not a popular one. What about being lightweight? Well, if it's an algorithm that requires running a particular process again and again until it converges (like K-means), maybe it's lightweight, but probably not so much since it's time-consuming. Also, most algorithms worth their salt aren't as simple as K-means, which though super-efficient, leaves a lot to be desired. Let's not forget the assumptions it makes about the clusters and its reliance on distance, which tends to fail when several dimensions are present. So, in a multi-dimensional data space, K-means isn't a good option, and just like any other clustering algorithm, it struggles. DBSCAN struggles too, but for a different reason (density calculations aren't easy, and in multi-dimensional space, they are a real drag). So, where does that leave us? Well, this is quite a beast that we have to deal with (the combination of a deterministic process and it being lightweight), so we'll need a bigger boat! We'll need an enormous boat, one armed with the latest weapons we can muster. Since we don't have the computational power for that, we'll have to make do with what we have, something that none of the other brilliant Clustering experts had at their disposal: BROOM. This framework can handle data in ways previously thought impossible (or at least unfeasible). High dimensionality? Check. Advanced heuristics for similarity? Check. An algorithm that features higher complexity without being computationally complex? Check. But the key thing BROOM yields that many Clustering experts would kill for is the initial centroids. Granted that they are way more than we need, it's better than nothing and better than the guesswork K-means relies on due to its nature. 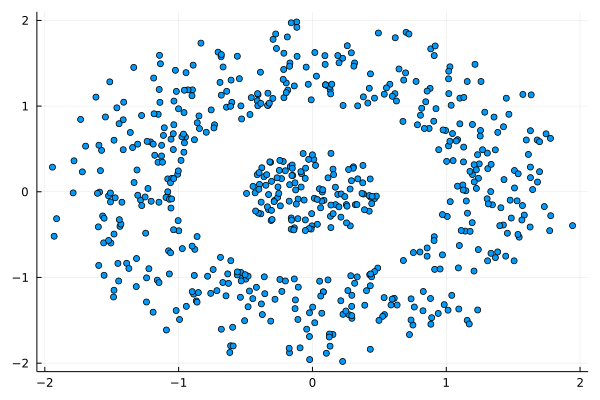 In the toy dataset visualized above, I applied the optimal clustering method I've developed based on BROOM, there were two distinct groups in the dataset across the approximately 600 data points located on a Euclidean plane. Interestingly, their centers were almost the same, so K-means wouldn't have a chance to solve this problem, no matter how many pluses you put after its name. The initial centroids provided by BROOM were in the ballpark of 75, which is way too high. After the first phase of the algorithm, they were reduced to 7 (!) though even that number was too high for that dataset. 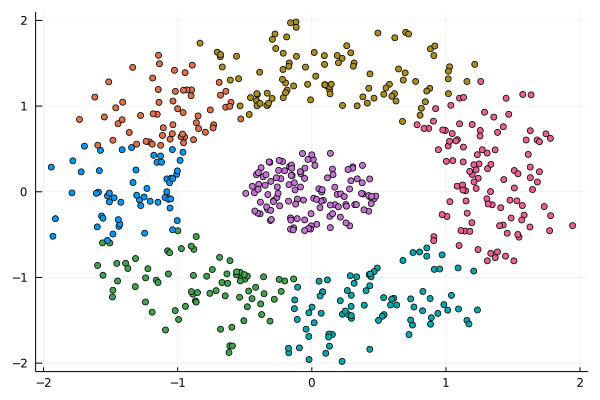 After some refinement, which took place in the second phase of the algorithm, they were reduced to 2. The whole process took less than 0.4 seconds on my 5-year-old laptop. The outputs of that Clustering algorithm included the labels, the centroids, the indexes of the data points of each cluster, the number of data points in each cluster, and the number of clusters, all as separate variables. Naturally, every time the algorithm was run it yielded the same results since it's deterministic. 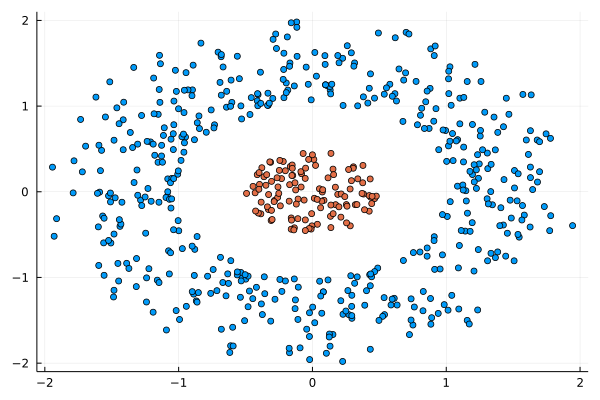 Before we can generalize the conclusions that we can draw from this case study, we need to do further experimentation. Nevertheless, this is a step in the right direction and a very promising start. Hopefully, others will join me in this research and help bring Clustering the limelight it deserves, as a powerful data exploration methodology. Cheers! Data visualization is a key aspect of data science work as it illustrates insights and findings very efficiently and effortlessly. It is an intriguing methodology that’s used in every data science and data analytics project at one point or another. However, many people today, particularly those in the data analytics field, entertain the idea that it’s best to perform this sort of task using Tableau, a paid data visualization tool. Note that there are several options when it comes to data visualization, many of which are either free or better-priced than Tableau. The latter appears to be popular as it was one of the first such software to become available. However, this doesn’t mean that it’s a good option, particularly for data scientists. So, what other options are there for data visualization tasks? For starters, every programming language (and even a math platform) has a set of visualization libraries. These make it possible to create plots on the fly, customizing them to your heart's content, and being able to replicate the whole process easily if needed through the corresponding script. Also, they are regularly updated and have a community around them, making it easy to seek help and advice on your data visualization tasks. Also, there are other data visualization programs, much more affordable than Tableau, which are also compatible with Linux-based operating systems. Tableau may be fine for Windows and macOS, but when it comes to GNU/Linux, it leaves you hanging. Let's shift gears a bit and look at the business aspect of data science work. In a data science team, there are various costs that can diminish its chances of being successful. After all, just like other parts of the organization, a data science team has a budget to work with. This budget has to cover a variety of tasks, from data governance costs (e.g. a big data system for storing and querying data), data analytics costs (e.g. cloud computing resources), and of course the salaries and bonuses of the people involved. Adding yet another cost to all this, for a Tableau subscription, doesn’t make much sense, especially considering how challenging it can be for a data science project to yield profits in the beginning. Also, considering that there are free alternatives for data visualization tasks, it makes more sense to invest in them (i.e. learn them instead). So what are some better ways to invest money for data science work? For starters, you can invest in the education of your team (e.g. through a course or a good book). Even if they are all adept in the essentials of data science work, they can always get up to speed on some new technology or methodology that can be used in some of their projects. Also, you can invest in additional equipment, upgrading the computers involved, and even getting more cloud resources. Finally, you can always invest in specialized software that is related to your domain or hire consultants to help out when needed. A few years ago, as I was writing the Data Science Mindset, Methodologies, and Misconceptions book, I mentioned Tableau as a data visualization alternative. However, I didn't look at the bigger picture of data science work from the organization's perspective. The latter is something my co-author and I did in our book Data Scientist Bedside Manner, which I'd encourage you to buy. In it we cover a variety of topics related to data science work and how there are better ways to invest resources for it, building towards a more successful pipeline. Cheers!  It may seem strange to have an article on this topic in this blog, but since hashgraph is a promising technology that I've already talked about in the past, it may be worthwhile to make an exception. As you may have heard, the Hedera platform is a hashgraph-based network that promises high speeds, very low cost, and a high level of security in it. All this is through the use of a new technology that one of its founders, Dr. Leeman Baird, created over the years. The idea is to use a clever combination of the gossip protocol along with virtual voting to ensure consensus in a network of computers, keeping track of various transactions. Up until now, this network has been used with a series of other applications but as of this year, a financial application has also become available. This takes the form of a cryptocurrency called hbar, which promises to be a worthwhile alternative to the blockchain-based cryptos. Whether hbar is going to make it or not remains to be seen, since BitCoin, Ethereum, Dash, and some other cryptos have attracted a large enough community to establish themselves, even if they are based on inferior technologies than hbar. Don't get me wrong, I think blockchain tech is amazing and may continue bringing about benefits to its users. Hashgraph, however, is superior in many ways, plus it has a legitimate company behind it, something that inspires confidence in many of its users. Some of these users are established companies such as Boeing, so it's not some hyped tech that may or may not exist a year from now. Hbar is being traded as of last week (September 17th to be exact) on the internet, after several months of beta-testing. Currently, it is available for trade on major crypto exchange sites, such as Bittrex and it's at a very low price (around 0.036 USD per token), even lower than the ICO one (0.12 USD). You can monitor its price from the Hedera-based site www.hbarprice.com where you can also learn additional information about the company and the various services they offer. Just like other innovative technologies, a hashgraph-based cryptocurrency seems a bit ahead of its time. In a way, it reminds me of the Julia language, which has been better in many ways than other data science programming platforms, yet it is still to receive the recognition it deserves. Whether this is due to the inertia of the tech people or the excessive promotion that its competitors receive is unknown. Whatever the case, those who make use of such technologies benefit even if the majority of people never fully accept them as worthwhile alternatives. So, I don't expect hbar to dominate the crypto market any time soon, but I'd be interested in following its course.  Everyone wants to do business especially when it comes to data science. The more someone is aware of the merits of this field and the value it can bring, the keener that person usually is. Whether it is for a hands-on project or something more high level, the wish to do a collaborative project is bound to rise, the more they get to know you and what you can do for them. However, just because you can work with someone on a potentially interesting and lucrative project, it doesn't mean that you should. Namely, there are certain red flags you ought to be aware of and which once spotted should make you rethink the whole endeavor. First of all, there is a lack of organization when it comes to the first meeting (and the ones that may follow). Many people want to meet but they often lack the basics of organizing a meeting. Sometimes the time is vague (e.g. they set up a day but not a clear time) or the place is unclear (e.g. there is agreement about using a VoIP system but there is no mention of which system or which room, as in the case of Zoom). If your potential client fails to provide such crucial information, probably they are still new to doing business and there are bound to be other discrepancies down the line. What’s more, the lack of clear objectives is something to be wary of. Some people want to do wonders with data science (esp. when A.I. is also leveraged) but they have no idea how. There are no clear objectives, deadlines, and the whole project feels more like a plan drafted by a 5-year-old. Situations like this spell out trouble since no matter how hard you work, they won’t be satisfied by your deliverables. Moreover, when someone doesn’t have a solid understanding of the field and has irrational expectations because of this. This ties into the previous point since the lack of clear objectives often stems from the lack of a solid understanding of what data science is and what it can do. With a perception tainted by the hype of data science and A.I., the client may be unaware of what is feasible and what isn't, leading to a very unrealistic set of expectations that no matter how good you are, you are unlikely to be able to meet. Furthermore, the lack of access to the actual data is a serious issue for a data science project. If I had a dime for every time I encountered this situation, I wouldn't need to work anymore! Yes, many people may have a clear plan and a solid understanding of data science but the data is not there. Sometimes they do have it but it is inaccessible and you have to go through miles of red tape just to get a glimpse of it. Cybersecurity and privacy processes are something completely unknown to clients like this, and they are overly protective of the data they have, granting you access to it only after you have signed a contract. However, embarking on a data science project without some exploratory data analysis first is like asking for trouble, but they don't usually understand that either. Finally, if the paperwork is not properly handled (contracts, NDAs, etc.) that’s a big red flag. This is the other extreme, whereby the client is very open about everything but has no idea of how the world works and doesn't bother with NDAs, formal contracts, etc. This way, if there are issues (something quite likely) you are screwed since there are no legal guarantees for the whole project making any pending payments as likely to become actual revenue as a lottery ticket! Also, the ownership of the IP involved in such a project can become a nightmare. Note that all these are red flags I’ve experienced myself so this list is by no means complete. Hopefully, it can give you an idea of things to look out for, ensuring that your data science expertise is not exploited or wasted in projects that are not likely to yield any benefit for you.  A few years back, at a period I was both inspired to experiment with different Complex Systems and had enough time on my hands, I created this interesting variant of John Conway's Game of Life. As the beings in this model evolved, I named it the Game of Evolving Life. I ran a bunch of simulations on it and analyzed the results, a project that took the form of a whole ebook, which I never got around to publishing. Whatever the case, I thought this project would make a good example for the Complex Systems subtopic of the previous video's topic, so I made a video on it. This new video is now online on Safari. Enjoy! Note that this video covers the main highlights of the model, with a very brief introduction to what complex systems are. Also, I focused on the more visual aspect of the analysis I'd done, otherwise it would be a much longer video that wouldn't be as interesting to most people. Finally, this whole thing was more of a programming exercise, so if you are looking at Data Science related videos that go into more depth on the methods of the craft, perhaps other videos would be better for you.  Introduction The idea of sampling is fundamental in data science and even though it is taught in every data science book or course out there, there is still a lot to be learned about it. The reason is that sampling is a very deep topic and just like every other data-related topic out there, conventional Statistics fails to do it justice. The reason is simple: good quality samples come about by obtaining an unbiased representation of a population and this is rarely the case from strictly random samples. Also, the fact that Statistics doesn’t offer any metric whatsoever regarding bias in a sample, doesn’t help the whole situation. The Index of Bias (IB) of a Sample There are two distinct aspects of a sample, its bias and its diversity. Here we’ll explore the former, as it is expressed in the two fundamental aspects of a distribution, its central point and its spread. For these aspects we’ll use two robust and fairly stable metrics, the median and the inter-quartile range, respectively. The deviation of a sample in terms of these metrics, with each deviation normalized based on the maximum deviation possible for the given data, yields two metrics, one of the central point and one for the spread. Each metric takes values between 0 and 1, inclusive. The average of these metrics is defined as the index of bias of a sample and takes values in the [0, 1] interval too. Note that the index of bias is always in relation to the original dataset we take the sample from. Although the above definition applies to one-dimensional data only, it can be generalized to n-dimensional data too. For example, we can define the index of bias of a dataset comprising of d dimensions (features) as the arithmetic mean of the index of bias of each one of its features. IB Scores for Various Samples Strictly random samples tend to have a fairly high IB score, considering that we expect them to be unbiased. That’s not to say that they are always very biased, but they are definitely in need of improvement. Naturally, if the data we are sampling is multi-dimensional, the chances of a bias are higher, resulting to an overall biased sample. Samples that are engineered with IB in mind are more likely to be unbiased in that sense. Naturally, this takes a bit of effort. Still, given enough random samples, it is possible to get a good enough sample that is unbiased based on this metric. In the attached file I include the IB scores of various samples, for both a random sampling process (first column) and a more meticulous one that aims to obtain a less biased sample (second column). Note that the latter did not use the IB metric in its algorithm, though a variant of it that makes use of that metric is also available (not free though). Also, you don’t need to be an expert in statistical tests to see that the second sampling method is consistently better than the first one. Finally, I did other tests on different data, and in every case, the results were very similar. Conclusions Hopefully, this small experiment goes on to show how sampling is not a trivial problem as it is made out to be by those who follow some old-fashioned paradigm for data analytics. Despite its simplicity, sampling has a lot of facets that need to be explored and understood, before it can be leveraged as a data science technique. After all, what good is an advanced model if the data it is trained on is biased? I believe we owe it to ourselves as data scientists to pay attention to every part of the data science process, including the less interesting parts, such as sampling.
 !ommon sense would dictate that this is not possible. After all, there are numerous articles out there (particularly on the social media) using that as a sign of a fallacy in an argument. Things like “most people claim that they have better than average communication skills, which is obviously absurd!” are not uncommon. However, a data scientist is generally cautious when it comes to claims that are presented without proof, as she is naturally curious and eager to find out for herself if that’s indeed the case. So, let’s examine this possibility, free from prejudice and the views of the know-it-alls that seem to “know” the answer to this question, without ever using a programming language to at least verify their claim. The question is clear-cut and well-defined. However, our common sense tells us that the answer is obvious. If we look into it more deeply though and are truly honest with ourselves, we’ll find out that this depends on the distribution of the data. A variable may or may not follow the normal distribution that we are accustomed to. If it doesn’t it’s quite likely that it is possible for the majority of the data points in a variable to be larger than the average value of that variable. After all, the average value (or arithmetic mean as it is more commonly known to people who have delved into this matter more), is just a measure of central tendency, certainly not the only measure for figuring out the center of a distribution. In the normal distribution, this metric coincides in value with that of median, which is always in the center of a variable, if you order its values in ascending or descending order. However, the claim that mean = median (in value) holds true only in cases of a symmetric distribution (like the normal distribution we are so accustomed to assuming it characterizes the data at hand). If the distribution is skewed, something quite common, it is possible to have a mean that is smaller than the median, in which case, the majority of the data points will be towards the right of it, or in layman’s terms, higher in value than the average. Don’t take my word for it though! Attached is a script in Julia that generates an array that is quite likely to have the majority of its elements higher in value than its overall mean. Feel free to play around with it and find out by yourselves what the answer to this question is. After all, we are paid to answer questions using scientific processes, instead of taking someone else’s answers for granted, no matter who that person is.
|
Zacharias Voulgaris, PhDPassionate data scientist with a foxy approach to technology, particularly related to A.I. Archives
April 2024
Categories
All
|
||||||||

 RSS Feed