|
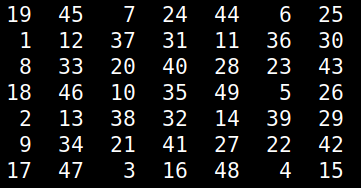
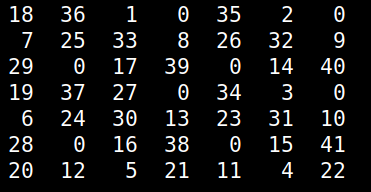
For over 2 decades there is a puzzle game I've played from time to time, usually to pass the time creatively or to challenge myself in algorithm development. This game, which I was taught by a friend, didn't have a name and I never managed to find it elsewhere so I call it Numgame (as it involves numbers and it's a game). Over the years, I managed to solve many of its levels though I never got an algorithm for it, until now. The game involves a square grid, originally a 10-by-10 one. The simplest grid that's solvable is the 5-by-5 one. The object of the game is to fill the grid with numbers, starting from 1 and going all the way to n^2, where n is the size of the grid, which can be any number larger than 4 (grids of this size or lower are not solvable). To fill the grid, you can "move" horizontally, vertically and diagonally, as long as the cell you go to is empty. When moving horizontally or vertically you need to skip 2 squares, while when you move diagonally you need to skip 1. Naturally, as you progress, getting to the remaining empty squares becomes increasingly hard. That's why you need to have a strategy if you are to finish the game successfully. Naturally, not all starting positions yield a successful result. Although more often than not you'd start from a corner, you may choose to start from any other square in the grid. That's useful, considering that some grids are just not solvable if you start from a corner (see image below; empty cells are marked as zeros) Before we look at the solution I've come across, try to solve a grid on your own and think about a potential algorithm to solve any grid. At the very least, you'll gain an appreciation of the solution afterward. Anyway, the key to solving the Numgame levels is to use a heuristic that will help you assess each move. In other words, you'll need to figure out a score that discerns between good and bad positions. The latter result from the various moves. So, for each cell in the grid, you can count how many legitimate ways are there for accessing it (i.e. ways complying with the aforementioned rules). You can store these numbers in a matrix. Then, you can filter out the cells that have been occupied already, since we won't be revisiting them anyway. This leaves us with a list of numbers corresponding to the number of ways to reach the remaining empty cells. Then we can take the harmonic mean of these numbers. I chose the harmonic mean because it is very sensitive to small numbers, something we want to avoid. So, the heuristic will take very low values if even a few cells start becoming inaccessible. Also, if even a single cell becomes completely inaccessible, the heuristic will take the value 0, which is also the worst possible score. Naturally, we aim to maximize this heuristic as we examine the various positions stemming from all the legitimate moves of each position. By repeating this process, we either end up with a full grid or one that doesn't progress because it's unsolvable. This simple problem may seem obvious now, but it is a good example of how a simple heuristic can solve a problem that's otherwise tough (at least for someone who hasn't tackled it enough to figure out a viable strategy). Naturally, we could brute-force the whole thing, but it's doubtful that this approach would be scalable. After all, in the era of A.I. we are better off seeking intelligent solutions to problems, rather than just through computing resources at them!
0 Comments
(image by Arek Socha, available at pixabay) Lately, I've been working on the final parts of my latest book, which is contracted for the end of Spring this year. As this is probably going to be my last technical book for the foreseeable future, I'd like to put my best into it, given the available resources of time and energy. This is one of the reasons I haven't been very active on this blog as of late. In this book (whose details I’m going to reveal when it’s in the printing press) I examine various aspects of data science in a quite hands-on way. One of these aspects, which I often talk about with my mentees, is that of scale. Scaling is very important in data science projects, particularly those involving distance-based metrics. Although the latter may be a bit niche from a modern standpoint where A.I. based systems are often the go-to option, there is still a lot of value in distances as they are usually the prima materia of almost all similarity metrics. Similarity-based systems, aka transductive systems, are quite popular even in this era of A.I. based models. This is particularly the case in clustering problems, whereby both the clustering algorithms and the evaluation metrics (e.g. Silhouette score/width) are based on distances for evaluating cluster affinity. Also, certain dimensionality reduction methods like Principle Components Analysis (PCA) often require a certain kind of scaling to function optimally. Scaling is not as simple as it may first seem. After all, it greatly depends on the application as well as the data itself (something not everyone is aware of since the way scaling/normalization is treated in data science educational material is somewhat superficial). For example, you can have a fixed range scaling process or a fixed center one. You can even have a fixed range and fixed center one at the same time if you wish, though it's not something you'd normally see anywhere. Fixed scaling is usually in the [0, 1] interval and it involves scaling the data so that its range is constant. The center point of that data (usually measured with the arithmetic mean/average), however, could be distorted. How much so depends on the structure of the data. As for the fixed center scaling, this ensures that the center of the scaled variable is a given value, usually 0. In many cases, the spread of the scaled data is fixed too, usually by setting the standard deviation to 1. Programmatic methods for performing scaling vary, perhaps more than the Stats educators will have you think. For example, in the fixed range scaling, you could use the min-max normalization (aka 0-1 normalization, a term that shows both limited understanding of the topic and vagueness), or you could use a non-linear function that is also bound by these values. The advantage of the latter is that you can mitigate the effect of any outliers, without having to eradicate them, all through the use of good old-fashioned Math! Naturally, most Stats educators shy away at the mention of the word non-linear since they like to keep things simple (perhaps too simple) so don’t expect to learn about this kind of fixed-range scaling in a Stats book. All in all, scaling is something worth keeping in mind when dealing with data, particularly when using a distance-based method or a dimensionality reduction process like PCA. Naturally, there is more to the topic than meets the eye, plus as a process, it's not as basic as it may seem through the lens of package documentation or a Stats book. Whatever the case, it's something worth utilizing, always in tandem with other data engineering tools to ensure a better quality data science project. |
Zacharias Voulgaris, PhDPassionate data scientist with a foxy approach to technology, particularly related to A.I. Archives
April 2024
Categories
All
|


 RSS Feed