|
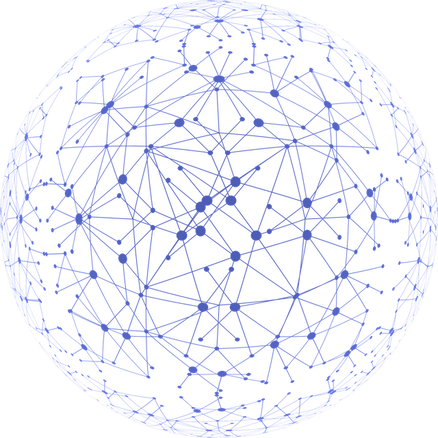
Not to be confused with graphics (visuals), graphs are a data structure used in data science work. This data analysis approach is quite popular today, yet it's not covered adequately in the data science literature. The fact that it's a fairly advanced topic may have something to do with that. In any case, graphs are a powerful tool as they capture information without worrying about dimensionality, which, although manageable in most cases, can be challenging to overcome in more complex problems. This article will explore graphs, the theory behind them, their applications, and how they are stored. Let's start by taking a look at graphs and the theory behind them. First of all, a graph is a representation of information in the form of a graphical structure consisting of nodes and arcs. Nodes represent entities of interest (e.g., people in a social media network), and arcs are the connections among these entities (e.g., an online friendship between them). The nodes and the arcs may have additional metadata attached to them, such as attributes (name of that person, date of birth, the duration of each friendship connection, etc.). The attribute that depicts the "strength" or "length" of an arc is referred to as its weight, and it's crucial for various graph algorithms. So, a graph can formally represent the relationships of a set of entities, along with any supplementary information involved. The mathematical framework of graphs and a series of useful theorems and heuristics are referred to as Graph Theory. Graphs have lots of useful applications in data science work. When they are used for data analysis, they go by the term Graph Analytics. This kind of analytics is an integral part of data science, although it's not always essential for the average data science project. For example, if you care about analyzing a complicated situation, like the logistics of an organization, graphs may come in very handy. However, if you care about predicting the next quarter's sales, graphs may be overkill, plus the problem would be more easily solved through a time series regression model. Also, for problems involving lots of dimensions, graphs can be handy because they can model the data points' relationships through a similarity metric that they can use as the set of weights of the various arcs in a graph. But where do we store these elaborate data structures? Fortunately, there are specialized databases for this task, aka graph databases. This kind of data storage and retrieval system allows for efficient encoding of the graphs and some useful operations with them. Neo4j is a popular such database, as well as a graph visualization tool. However, there are others more refined that are also able to manage enormous datasets. Most modern graph databases today are NoSQL databases that can handle other kinds of datasets, not just graph-based ones. A well-known such database is ArangoDB. If you are interested in learning more about this and other useful data science methodologies, check out my book Data Science Mindset, Methodologies, and Misconceptions. In this manuscript, I delve into all kinds of methodologies related to data science work, including graphs and NoSQL databases. However, the focus is on the data science mindset, which is essential for any data scientist as well as remaining relevant in this field. Check it out when you have a moment. Cheers!
0 Comments
Your comment will be posted after it is approved.
Leave a Reply. |
Zacharias Voulgaris, PhDPassionate data scientist with a foxy approach to technology, particularly related to A.I. Archives
April 2024
Categories
All
|

 RSS Feed