 Being an author has many benefits, some of which I’ve mentioned in a previous article. After all, an author (particularly a technical author) is more than just a writer. The former has undergone the scrutiny of the editing process, usually undertaken by professionals, while a writer may or may not have done the same. Also, an author has seen a writing project to its completion and has gotten a publisher to put his or her stamp of approval on that manuscript, before making it available to a larger audience. This raises the stakes significantly and adds a great deal of gravity to the book at hand. Being an author is its own reward (even though there are other tangible rewards to it too, such as the royalties checks every few months!). However, there is a benefit that is much less obvious although it is particularly useful. Namely, an author can appreciate other authors more and learn from them. This is something that I have come to learn since my first book, yet this appreciation has reached new heights since then. This is especially the case when it comes to veteran authors who have developed more than one book. All this leads to an urge to read more books and get more out of them. This is due to the value an author puts into these books. Instead of just a collection of words and ideas, he views a book as a sophisticated structure comprising of many layers. Even simple things like graphics take a new meaning. Of course, much of this detailed view of a book is a bit technical but the appreciation that this extra attention contributes to is something that lingers for long after the book is read. Nevertheless, you don't need to be an author to have the same appreciation towards other people's books. This is something that grows the more you practice it and can evolve into a sense of discernment distinguishing books worth having on your bookshelf from those that you are better off leaving on the store! At the very least this ability can help you save time and money since it can help you focus on those books that have the most to offer to you. In my experience, Technics Publications has such books worth keeping close to you, particularly if you are interested in data-related topics. This includes data science but also other disciplines like data modeling, data governance, etc. There is even a book on Blockchain, which I found very educational when I was looking into this technology, which goes beyond its cryptocurrency applications. Anyway, since good books come at a higher cost, you may want to take advantage of a special promo the publisher is doing, which gives you a 20% discount for all books, except the DMBOK ones. To get this discount, just use the DSML coupon code at the checkout (see image below).  Note that this coupon code applies to virtual classes offered by Technics Publications (i.e. the virtual training courses in the ASK series). This, however, is a topic for another article. Cheers!
0 Comments
 Hi everyone. Since these days I explore a different avenue for data science education, I've put together another webinar that's just 3 weeks away (May 18th). If you are interested in AI, be it as a data science professional or a stakeholder in data science projects, this is something that can add value to you. Also, you'll have a chance to ask me questions directly and if the time allows, even have a short discussion on this topic.
Note that due to the success of previous webinars in the Technics Publications platforms, the price of each webinar has risen. However, this upcoming webinar, which was originally designed as a talk for an international conference in Germany, is still at the very accessible price of $14.99. Feel free to check it out here and spread the word to friends or colleagues. You can also learn about the other webinars this platform offers through the corresponding web page. Cheers!  These days I didn't have a chance to prepare an article for my blog. Between helping out a friend of mine and preparing for my webinar this Thursday, I didn't have the headspace to write anything. Nevertheless, one of the articles I wrote for my friend's initiative, related to mentoring, is now available on Medium. Feel free to check it out! As for the webinar, it's about the data science mindset, a topic I talked about on all of my books, particularly the Data Science Mindset, Methodologies, and Misconceptions one. At the time of this writing, there are still some spots available for the webinars, so if you are interested, feel free to register for it here. On another note, my latest book is almost ready for the review stage so I'll be working on that come Friday. Stay tuned for more details in the weeks to come... That's all for now. I hope you have a great week. Stay healthy and positive!  In the previous post (not counting the webinars one, which was more of an announcement), I talked a bit about a new high-level model about scientific knowledge. However, I didn't talk much about its evolution, since that would make for a very long article (or even a book!). In this article, I'll look into some additional parts of this model and how it can help us understand the evolution of scientific knowledge. All this is closely tied to the data science mindset since, at its core, Data Science is applied science in real-world problems. So, in the previous article, we covered research, fidelity, and application as the key aspects of scientific knowledge and how the three of them are closely linked to a fourth one, the scope. But how do all these relate to the scientist and her work? Let's find out. So, if you recall, the aforementioned factors can be visualized in the schematic we saw in the previous post. 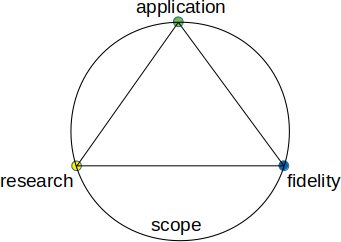 But what lies in the middle of this? What’s at the heart of scientific knowledge? If you guessed the scientific method, you are right. After all, scientific knowledge doesn't grow on trees (with the exception of that apple tree upon which Newton was resting, perhaps). The scientific method is at the core of it since it binds research, fidelity, and even application to some extent. When an engineer (or even the scientist herself) explores a new theory and tests its validity, he makes use of the scientific method. Without it, he could still argue for or against the theory, but it would be more of a philosophical kind of treatise than anything else. Naturally, philosophy has value too, especially when it is a practical kind of philosophy, like that of the Stoics. However, in science, we are interested more in things that can be formulated with mathematical formulas and be tested rigorously through various data analytics tools, such as Statistics. This scientific method also constitutes the mindset of the scientist, something very important across different disciplines. Now, if we were to explore this further, going beyond the plane of all the aforementioned aspects of scientific knowledge, we’d find (at least) two more aspects that are closely related to all this. Namely, we’ll find understanding and vision, both of which have to do with the scientist primarily. Understanding involves how deep we go into the ideas the scientific knowledge entails. It is not just rational though since it involves our intuition too. Understanding is like the roots of a tree, grounding scientific knowledge to something beyond the data and making the scientific theory we delve into something potentially imbued by enthusiasm. When you hear some scientists talk about their inventions, for example, you can almost feel that. No scientist would get passionate about math formulas but when it comes to the understanding of the scientific knowledge they have worked on, they can get quite passionate about it for sure! On the other direction of this we have vision, which has to do with what we imagine about the scientific knowledge, be it its applicability, its extensions, and even the questions it may raise. The latter may bring about additional scientific projects, evolving the knowledge (and understanding) further. That's why it makes sense to visualize this as an upwards vector. Besides, we talk about understanding going deep, which is why we'd visualize it as a downwards vector. Naturally, we'd expect these to be correlated to some extent since deeper understanding would make for loftier visions regarding the scientific knowledge we explore. Also, these two aspects of scientific knowledge highlight the evolutionary aspect of it, rending it something highly dynamic and adaptive. 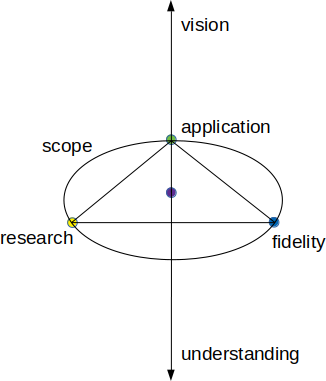 Hopefully, this article has shed some light on this intriguing topic. It may be a bit abstract but scientific knowledge is like this, at least until it manifests as technology. Feel free to share your thoughts on this topic through this blog. Cheers!
 Webinars have been a valuable educational resource for years now, but only recently has the potential of this technology been valued so much. This is largely due to the Covid-19 situation that has made conventional conferences a no-no. Also, the low cost of webinars, coupled with the ecological advantage they have over their physical counterparts, makes webinars a great alternative. At a time when video-based content is in abundance, it's easy to find something to watch and potentially educate yourself with. However, if you want quality content and value your time more than the ease of accessibility of the stuff available for free, it's worth exploring the webinar option. Besides, nowadays the technology is more affordable than ever before, making it a high ROI endeavor. As a bonus, you get to ask the presenter questions and do a bit of networking too. How does all this fit with data science though and why is it part of this blog? Well, although webinars are good in general, they are particularly useful in data science as the latter is a hot topic. Because it's such a popular subject, data science has attracted all sorts of opportunists who brand themselves as data scientists just to make a quick buck. These people tend to create all sorts of content that is low veracity information at best (and a scam at worst). Since discerning between what's legitimate content and what's just click-bait can sometimes be difficult (these con artists have become pretty good at what they do), it makes sense to pursue reputable sources for this video content. One such source is the Technics Publications platform, which has recently started providing its own video content in the form of webinars. Although most of these webinars are on data modeling, a couple of them are on data science topics (ahem). Feel free to check them out! Disclaimer: I have a direct monetary benefit in promoting these data science webinars. However, I do so after ensuring I put a lot of work in preparing them, the same amount of work I’d put in preparing for a physical conference, like Customer Identity World and Data Modeling Zone. The only difference is the medium through which this content is delivered.  Even if you are not a Bayesian Stats fan, it’s not hard to appreciate this data analytics framework. In fact, it would irresponsible if you were to disregard it without delving into it, at least to some extent. Nevertheless, the fact is that Frequentist Stats (see image above), as well as Machine Learning, are more popular in data science. Let's explore the reasons why this is. Bayesian Stats relies primarily on the various versions of the Bayes Theorem. In a nutshell, this theorem states that if we have some idea of the a priori probabilities of an event A happening (as well as A not happening), as well as the likelihoods of event B happening given event A happening (as well as A not happening), we can estimate the probability of A given B. This is useful in a variety of cases, particularly when we don't have a great deal of data at our disposal. However, there is something often hard to gauge and it's the Achilles heel of Bayesian Stats. Namely, the a priori probabilities of A (aka the priors) are not always known while when they are, they are usually rough estimates. Of course, this isn't a showstopper for a Bayesian Stats analysis, but it is a weak point that many people are not comfortable with since it introduces an element of subjectivity to the whole analysis. In Frequentist Stats, there are no priors and the whole framework has an objective approach to things. This may seem a bit far-fetched at times since lots of assumptions are often made but at least most people are comfortable with these assumptions. In Machine Learning, the number of assumptions is significantly smaller as it's a data-driven approach to analytics, making things easier in many ways. Another matter that makes Bayesian Stats not preferable for many people is the lack of proper education around this subject. Although it predates Frequentist Stats, Bayesian Stats never got enough traction in people's minds. The fact that Frequentist Stats was advocated by a very charismatic individual who was also a great data analyst (Ronald A. Fisher) may have contributed to that. Also, the people who embraced the different types of Statistics at the time augmented the frameworks with certain worldviews, making them more like ideological stances than anything else. As a result, since most people who worked in data analytics at the time were more partial towards Fisher's worldview, it made more sense for them to advocate Frequentist Stats. The fact that Thomas Bayes was a man of the cloth may have dissuaded some people from supporting his Statistics framework. Finally, Bayesian Stats involves a lot of advanced math when it is applied to continuous variables. As the latter scenario is quite common in most data analytics projects, Bayesian Stats ends up being a fairly esoteric discipline. The latter entails things like Monte Carlo simulations (which although fairly straightforward, they are not as simple as distribution plots and probability tables) and Markov Chains. Also, there are lots of lesser-known distributions used in Bayesian Stats (e.g. Poisson, Beta, and Gamma, just to name a few) that are not as simple or elegant as the Normal (Gaussian) distribution or the Student (t) distribution that are bread and butter for Frequentist Stats. That's not to say that the latter is a walk in the park, but it's more accessible to a beginner in data analytics. As for Machine Learning, contrary to what many people think, it too is fairly accessible, especially if you use a reliable source such as a course, a book, or even an educational video, etc. with a price tag accompanying it. Summing up, Bayesian Statistics is a great tool that’s worth exploring. If, however, you find that most data analytics professionals don’t share your enthusiasm towards it, don’t be dismayed. This is something natural as the alternative frameworks maintain an advantage over Bayesian Stats. 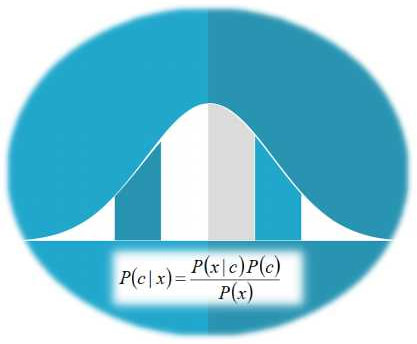 Lately, there has been a lot of talk about the Corona Virus disease (Covid-19) and Italy is allegedly a hotspot. As my partner lives in Italy and is constantly bombarded by warnings about potential infections and other alarming news like that, I figured it would be appropriate to do some back-of-the-envelop calculations about this situation and put things in perspective a bit. After all, Bologna (the city where she lives) is not officially a "red zone" like Milan and a few other cities in the country. For this analysis, I used Bayes' Theorem (see formula below) along with some figures I managed to dig up, regarding the virus in the greater Bologna area. The numbers may not be 100% accurate but they are the best I could find, while the assumption made was more than generous. 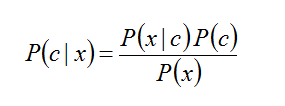 Namely, I used the latest numbers regarding the spread of the disease as the priors, while regarding the likelihoods (conditional probabilities regarding the test made) I had to use two figures, one from the Journal of Radiology to figure out the false positives rate (5 out of 167 or about 3%, in a particular study) and one for the true positive rate (aka precision), the aforementioned assumption, namely 99%. In reality, this number is bound to be lower but for the sake of argument, let's say that it's correct 99% of the time. Note that certain tests regarding the Covid-19 using CT scans can be as low as 80%, while the test kits available in some countries have even lower precision. For the priors, I used the data reported in the newspaper, namely around 40 for the greater Bologna area. The latter has a population of about 400 000 people (including the suburbs). So, given all that, what are the chances you actually have the virus if you do a test for it the result comes back positive?
Well, by doing the math on Bayes’ theorem, it can take the form: P(infection | positive) = P(positive | infection) * P(infection) / [P(positive | infection) * P(infection) + P(positive | healthy) * P(healthy)] As being infected and being healthy are mutually exclusive, we can say that P(healthy) = 1 – P(infection). Doing some more math on this we end up with this slightly more elegant formula: P(infection | positive) = 1 / [1 + λ (1 / P(infection) – 1)] where λ = P(positive | healthy) / P(positive | infection). Plugging in all the numbers we end up with: P(infection | positive) = 1 / (1 + 303) = 0.3% (!) In other words, even if you do a proper test for Covid-19, and the test is positive (i.e. the doctor tells you “you’re infected”) the chances of this being true are about 1 in 300. This is roughly equivalent to rolling a triple 1 using 3 dice (i.e. you roll three dice and the outcome is 1-1-1). Of course, if you don’t test positive, the chances of you having the virus are much lower. Note that the above analysis is for the city of Bologna and that for other cities you'll need to update the formula with the numbers that apply there. However, even if the scope of this analysis is limited to the greater Bologna area, it goes on to show that this whole situation that plagues Italy is more fear-mongering than anything else. Nevertheless, it is advisable to be mindful of your health as during times of changing weather (and climate), your immune system may need some help to ensure it keeps your body healthy, so anything you do to help it is a plus. Things like exercise, a good diet, exposure to the sun, keeping stress at bay, and maintaining good body hygiene are essential regardless of what pathogens may or may not threaten your well-being. Stay healthy! 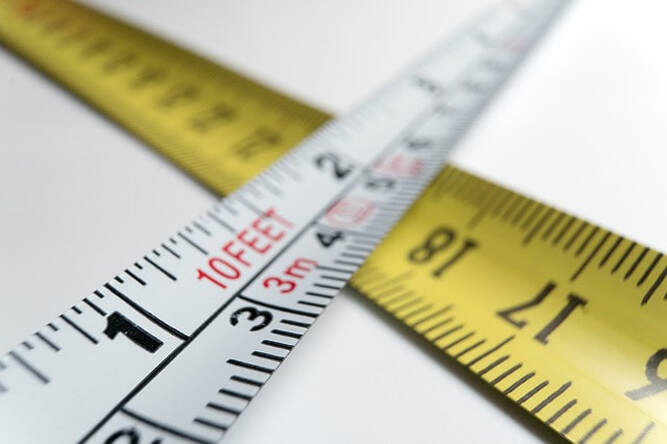 (image by Arek Socha, available at pixabay) Lately, I've been working on the final parts of my latest book, which is contracted for the end of Spring this year. As this is probably going to be my last technical book for the foreseeable future, I'd like to put my best into it, given the available resources of time and energy. This is one of the reasons I haven't been very active on this blog as of late. In this book (whose details I’m going to reveal when it’s in the printing press) I examine various aspects of data science in a quite hands-on way. One of these aspects, which I often talk about with my mentees, is that of scale. Scaling is very important in data science projects, particularly those involving distance-based metrics. Although the latter may be a bit niche from a modern standpoint where A.I. based systems are often the go-to option, there is still a lot of value in distances as they are usually the prima materia of almost all similarity metrics. Similarity-based systems, aka transductive systems, are quite popular even in this era of A.I. based models. This is particularly the case in clustering problems, whereby both the clustering algorithms and the evaluation metrics (e.g. Silhouette score/width) are based on distances for evaluating cluster affinity. Also, certain dimensionality reduction methods like Principle Components Analysis (PCA) often require a certain kind of scaling to function optimally. Scaling is not as simple as it may first seem. After all, it greatly depends on the application as well as the data itself (something not everyone is aware of since the way scaling/normalization is treated in data science educational material is somewhat superficial). For example, you can have a fixed range scaling process or a fixed center one. You can even have a fixed range and fixed center one at the same time if you wish, though it's not something you'd normally see anywhere. Fixed scaling is usually in the [0, 1] interval and it involves scaling the data so that its range is constant. The center point of that data (usually measured with the arithmetic mean/average), however, could be distorted. How much so depends on the structure of the data. As for the fixed center scaling, this ensures that the center of the scaled variable is a given value, usually 0. In many cases, the spread of the scaled data is fixed too, usually by setting the standard deviation to 1. Programmatic methods for performing scaling vary, perhaps more than the Stats educators will have you think. For example, in the fixed range scaling, you could use the min-max normalization (aka 0-1 normalization, a term that shows both limited understanding of the topic and vagueness), or you could use a non-linear function that is also bound by these values. The advantage of the latter is that you can mitigate the effect of any outliers, without having to eradicate them, all through the use of good old-fashioned Math! Naturally, most Stats educators shy away at the mention of the word non-linear since they like to keep things simple (perhaps too simple) so don’t expect to learn about this kind of fixed-range scaling in a Stats book. All in all, scaling is something worth keeping in mind when dealing with data, particularly when using a distance-based method or a dimensionality reduction process like PCA. Naturally, there is more to the topic than meets the eye, plus as a process, it's not as basic as it may seem through the lens of package documentation or a Stats book. Whatever the case, it's something worth utilizing, always in tandem with other data engineering tools to ensure a better quality data science project.  More important than remembering facts and methods related to data science problems is the trinity of inspiration, intuition, and imagination, with intelligence binding them all together. However, without inspiration, none of the stuff we know about data science is bound to grow much as our knowledge and know-how gradually crystallize and start giving in to entropy. So, I'd like to take a moment and remind everyone (including myself) the value of inspiration, even in a fairly technical field such as data science (I don't mention A.I. here because A.I. is its own source of inspiration, especially when one considers the applications of it). So, what's your data science inspiration like? Where does it come from? What does it incentivize you towards? These are questions we need to ask ourselves from time to time, in order to make our learning of the field a sustainable process. The input of other data scientists is important in helping that but they may not always inspire us, especially after we grow out of the initial stages of our learning. This beginner’s mind although powerful is also fleeting and once it gives way to a more pragmatic view of data science, it is easy to lose our original enthusiasm for the field. That’s where inspiration comes in. For me, the source of inspiration in data science is two-fold: first of all, it is my own research on the field, unbound by an academic agenda or a particular ideology (e.g. futurism). Such research is still disciplined but at the same time somewhat free, as in freedom (you can’t have research void of cost, unfortunately, even if that cost is just the time you dedicate to it). The other source of inspiration is mentoring, particularly students who are committed to learning data science through a structured and disciplined manner, such as the Thinkful courses on the subject. Naturally, I’d be happy to mentor other data science aspirants but so far this hasn’t taken place, for various reasons. Beyond these, the educational material I create as well as the conferences I participate in can be a great source of inspiration too. However, these are not things that happen frequently enough so as to consider them as primary sources of inspiration, no matter how impactful they can be at times. In practice, they often act as conduits of inspiration, to a certain extent, something that’s also valuable. After all, all these aspects of my data science presence are interconnected and feed off each other. What about you? What’s your inspiration for data science like? Does it come from a particular application, methodology, or educational material? How do you ensure that inspiration is part of your data science life?  Lately, I've been busy with preparations for my conference trips, hence my online absence. Nevertheless, I found time to write something for you all who keep an open mind to non-hyped data science and A.I related content. So, this time I'd like to share a few thoughts on programming for data science, from a somewhat different perspective. First of all, it doesn't matter that much what language you use, if you have attained mastery of it. Even sub-Julia languages can be useful if you know how to use them well. However, in cases where you use a less powerful language, you need to know about lambda functions. I mastered this programming technique only recently because in Julia the performance improvement is negligible (unless your original code is inefficient to start with). However, as they make for more compact scripts, it seems like useful know-how to have. Besides, they have numerous uses in data science, particularly when it comes to:
Another thing that I’ve found incredibly useful, and which I mastered in the past few weeks, is the use of auxiliary functions for refactoring complex programs. A large program is bound to be difficult to comprehend and maintain, something that often falls into the workload of someone else you may not have a chance to help out. As comments in your script may also prove insufficient, it’s best to break things down to smaller and more versatile functions that are combined in your wrapper function. This modular approach, which is quite common in functional programming, makes for more useful code, which can be reused elsewhere, with minor modifications. Also, it’s the first step towards building a versatile programming library (package). Moreover, I’ve rediscovered the value of pen and paper in a programming setting. Particularly when dealing with problems that are difficult to envision fully, this approach is very useful. It may seem rudimentary and not something that a "good data scientist" would do, but if you think about it, most programmers also make use of a whiteboard or some other analog writing equipment when designing a solution. It may seem like an excessive task that may slow you down, but in the long run, it will save you time. I've tried that for testing a new graph algorithm I've developed for figuring out if a given graph has cycles (cliques) in it or not. Since drawing graphs is fairly simple, it was a very useful auxiliary task that made it possible to come up with a working solution to the problem in a matter of minutes. Finally, I discovered again the usefulness of in-depth pair-coding, particularly for data engineering tasks. Even if one's code is free of errors, there are always things that could use improvement, something that can be introduced through pair-coding. Fortunately, with tools like Zoom, this is easier than ever before as you don't need to be in the same physical room to perform this programming technique. This is something I do with all my data science mentees, once they reach a certain level of programming fluency and according to the feedback I've received, it is what benefits them the most. Hopefully, all this can help you clarify the role of programming in data science a bit more. After all, you don't need to be a professional coder to make use of a programming language in fields like data science. |
Zacharias Voulgaris, PhDPassionate data scientist with a foxy approach to technology, particularly related to A.I. Archives
December 2022
Categories
All
|
 RSS Feed