|
Image taken from math.ucdavis.edu
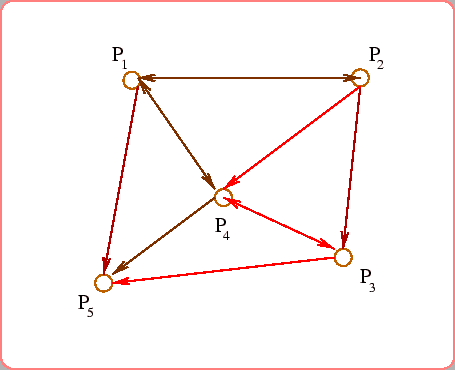
Graphs have become more and more popular in data science in the past few years. In fact, it is highly unlikely that you haven’t used a graph in your analytics work, even without realizing it. Decision trees and neural networks, for example, are special cases of graphs, of the DAG category (Directed Acyclical Graphs). Developing a graph, however, in order to model a problem or a process is not a trivial task. Maybe it’s easy for employees of FB and LI, who work with graphs all day long, but for the average data scientist, it can be a bit of a challenge. The reason is simple: graphs deal with an abstraction of a feature space / process, in such a way that they only have two main dynamics: objects (aka vertexes or nodes) and the relationships among these objects (aka edges or arcs). So, how do you go about developing a graph to express a particular data set or a process (e.g. a machine learning model)? Well, you need to talk to your business liaison first and make sure that you understand the requirements of the model you are trying to develop. You can make a great graph that represents your data perfectly but it may not be the droid that he/she is looking for! So, step 0 would be to make sure that you are in alignment with the business directive and the question(s) you are aiming to answer through your data analytics efforts. Once you have figured that out, it is fairly easy to craft your graph. You just need to follow the following steps:
Note that you may often have to make assumptions about the connectivity of the nodes, since you don’t want to make your graph too complicated. Although there are perks to having a fully connected graph, the computational overhead of such a graph model may not justify the additional cost in terms of resources required to store and process the graph. So, you may want to include a threshold below which a connection is rendered absent (i.e. the corresponding nodes appear disconnected). This will of course have to do with the weights of the edges and you may need to do some analytics to come up with a meaningful threshold. Even though graphs have their own algorithms for processing the data they represent, they are not divorced from statistics and other data analysis tools. People who see graphs as a completely separate part of data science have not understood them in depth. We recommend that you distance yourself as much as possible from those people and join our sub-graph of data scientists: the ones who use all data analytics tools in tandem, without having silos among them. After all, a well-connected graph is bound to yield more interesting (and oftentimes more meaningful) insights. Isn’t that why you craft graphs in the first place?
0 Comments
Your comment will be posted after it is approved.
Leave a Reply. |
Zacharias Voulgaris, PhDPassionate data scientist with a foxy approach to technology, particularly related to A.I. Archives
April 2024
Categories
All
|

 RSS Feed