 As mentioned in a previous post, translinearity is a concept describing the fluidity of the linear and the non-linear, as they are combined in a unified framework. However, linear relationships are still valuable, particularly if you want to develop a robust model. It's just that the rigid classification between linear and non-linear is arbitrary and meaningless when it comes to such a model. To clarify this whole matter I started exploring it further and developed an interesting heuristic to measure the level of non-linearity on a scale that's intuitive and useful.
So, let's start with a single feature or variable. How does it fare by itself in terms of linearity and non-linearity? A statistician will probably tell you that this sort of question is meaningless since the indoctrination he/she has received would make it impossible to ask anything that's not within a Stats course's curriculum. However, the question is meaningful even though it's not as useful as the follow-up questions that can ensue. So, depending on the data in that feature, it can be linear, super-linear, or sub-linear, in various degrees. The Index of Non-Linearity (INL) metric gauges that and through the values it takes (ranging from -1 to 1, inclusive) we can assess what a feature is like on its own. Naturally, these scores can be easily shifted by a non-linear operator (e.g. sqrt(x) or exp(x)) while all linear operators (e.g. standard normalization methods) do not affect these scores. Also, at the current implementation of INL, the value of the heuristic is calculated using three reference points in the variable. Having established that, we can proceed to explore how a feature fares in relation to another variable (e.g. the target variable in a predictive analytics setting). Usually, the feature is used as the independent variable and the other variable as the dependent one, though you can explore the reverse relationship too, using this same heuristic. Interestingly the problem is not as simple now because the two variables need to be viewed in tandem. That's why all the reference points used shift if we change the order of the variables (i.e. the heuristic is not symmetric). Whatever the case, it is still possible to calculate INL with the same idea but taking into account the reference values of both variables. In the current implementation of the heuristic, the values can go a bit off-limits, which is why they are bound artificially to the [-1, 1] range. Naturally, metrics like INL are just the tip of the iceberg in this deep concept. However, the existence of INL illustrates that it is possible to devise heuristics for every concept in data science, as long as we are open to the possibilities the data world offers. Not everything has been analyzed through Stats, which despite its indisputable value as a data science tool, it is still just one framework, a singular way of looking at things. Fortunately, the data-scapes of data science can be viewed in many more ways leading to intriguing possibilities worth exploring.
0 Comments
 Everyone in data science (and even beyond data science to some extent) is familiar with the process of sampling. It’s such a fundamental method in data analytics that it’s hard to be unaware of it. The fact that’s so intuitive as well makes it even easier to comprehend and apply. Besides, in the world of Big Data, sampling seems to be not only useful but also necessary! What about data summarization though? How does that fit in data science and how does it differ from sampling? Both data summarization and sampling aim to reduce the number of data points in the data set. However, they go about it in very different ways. For starters, sampling usually picks the data points randomly while in some cases, it takes into account an additional variable (usually the target variable). The latter is the case of stratified sampling, something essential if you want to perform proper K-fold cross-validation for a classification problem. Data summarization, on the other hand, creates new data points that aim to contain the same information as the original dataset, or at least retain as much of it as possible. Another important difference between the two methodologies is that data summarization tends to be deterministic, while sampling is highly stochastic. This means that you cannot use data summarization instead of sampling, at least not repeatedly as in the case of K-fold cross-validation. Otherwise, you’ll end up with the same results every time, something that doesn’t help with the validation of the models at hand! Perhaps that’s one of the reasons why data summarization is not so widely known in the data science community, where model validation is a key focus of data science work. What’s more, if sampling is done properly, it can maintain the relationships among the variables at hand (obviously this would entail the use of some heuristics since random sampling alone won’t cut it). Data summarization, on the other hand, doesn't do that so well, partly because it focuses on the most important aspects of the dataset, discarding everything else. This results in skewing the variable relationships a bit, much like a PCA method changes the data completely when it is applied. So, if you care about maintaining these variable correlations, data summarization is not the way to go. Finally, due to the nature of the data involved, data summarization could be used for data anonymization and even data generation. Sampling, however, wouldn't work so well for these sorts of tasks, even though it could be used for data generation if the sampling is free of biases (something which can also be attained if certain heuristics are applied). All this illustrates the point that although these two methods are quite different, they are also applicable in different use cases so they don’t exactly compete with each other. It’s up to the discerning data scientist to figure out when to use which, adding value to the project at hand. Throughout this blog, I've talked about all sorts of problems and how solving them can aid one's data science acumen as well as the development of the data science mindset. Problem-Solving skills rank high when it comes to the soft skills aspect of our craft, something I also mentioned in my latest video on O'Reilly. However, I haven't talked much about how you can hone this ability.
Enter Brilliant, a portal for all sorts of STEM-related courses and puzzles that can help you develop problem-solving, among other things. If you have even a vague interest in Math and the positive Sciences, Brilliant can help you grow this into a passion and even a skill-set in these disciplines. The most intriguing thing about all this is that it does so in a fun and engaging way. Naturally, most of the stuff Brilliant offers comes with a price tag (if it didn't, I would be concerned!). However, the cost of using the resources this site offers is a quite reasonable one and overall good value for money. The best part is that by signing up there you can also help me cover some of the expenses of this blog, as long as you use this link here: www.brilliant.org/fds (FDS stands for Foxy Data Science, by the way). Also, if you are among the first 200 people to sign up you'll get a 20% discount, so time is definitely of the essence! Note that I normally don't promote anything of this blog unless I'm certain about its quality standard. Also, out of respect for your time I refrain from posting any ads on the site. So, whenever I post something like this affiliate link here I do so after careful consideration, opting to find the best way to raise some revenue for the site all while providing you with something useful and relevant to it. I hope that you view this initiative the same way.  So, the 7th quiz video I've created is finally online on O'Reilly. This is the longest one so far spanning over 51 minutes, meaning there are lots of explanations for the various questions. It covers a bunch of topics, such as A/B testing, ANOVA, and various statistical tests. I put a lot of thought in this, much like you'd put a lot of thought in designing a data science experiment. Hopefully, you'll find it as useful and enjoyable as I did. Note that just like other videos published on O'Reilly, you'll need to have an active account (even if it's a trial one), in order to view it in its entirety. As a bonus, you'll be able to view other videos as well as books available on that platform. Enjoy!  Dimensionality reduction has been a standard methodology to deal with datasets that have a lot of features, more than a typical model can handle effectively. Reducing the number of features can also save time and storage space, while when it comes to sensitive data it can be a big plus as it enables anonymity in the people involved. What’s more, in some cases, a reduced dimensionality dataset can be more effective as there is less noise in it. However, conventional dimensionality reduction methods don’t always do the trick due to the inherent limitations they have. For example, PCA only considers linear relationships among the variables and a linear combination of features, as a solution. Of course, other people are not sitting idle when it comes to this issue. There are several dimensionality reduction options that are being pursued, the most interesting of which is autoencoders. This AI-based method involves a data-driven approach to figuring out the nature of the data and creating new variables that can represent the underlying signal, by minimizing the error. The issue with this is that it often requires a lot of data and some specialized know-how in order to configure optimally. Also, this whole process may be fairly slow, due to the large number of computations involved. An alternative approach has to do with feature fusion in a non-AI way. The idea is to maintain transparency to the extent this is possible, while at the same time optimize the whole process in terms of speed. The use of multiple operators, some linear and some non-linear, is essential, while the option of dropping useless features is also very useful. Naturally, this whole process would be more effective in the presence of a target variable, but it should be able to work without it, for better applicability. Whatever the case, the use of a metric able to handle non-linear correlations is paramount since the conventional correlation metric used leaves a lot to be desired. Based on all this, it’s clear that the dimensionality reduction area is still capable of enhancements. Despite the great work that has been done already, there is still room for new methods that can address the limitations the existing methods have, which aren’t going away any time soon. Perhaps it would be best to explore this methodology of data engineering more, instead of focusing the latest and greatest system, which although intriguing, may sacrifice too much (e.g. transparency) in the name of accuracy, a trade-off that may no longer be cost-effective. Something to think about... 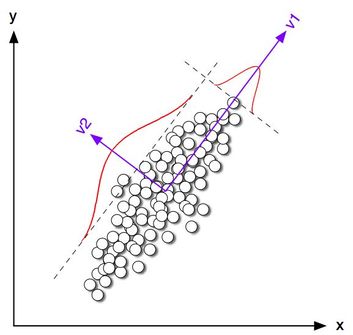 (Image by lazyprogrammer.me)
PCA has attracted a lot of questions among all of my mentees over the years, so I decided to make a fairly in-depth video on the topic. Unlike other education material on PCA, this one is light on the math, while there is a lot of emphasis on the concepts as well as how they apply to a data scientist's work. You can check out the video on Safari here. Note that in order to view the video in its entirety you'll need a subscription to the Safari platform. Cheers!  Lately it’s hard to find someone who is a legit data scientist and yet doesn’t talk about Stats as if it’s a new religion or something. Don’t get me wrong; I find Stats a very useful tool in data analytics, especially data science. However, there are other, usually most suitable options out there to have in one’s data science toolbox. First of all, Statistics is the state-of-the-art approach to data modeling, if you live in the mid 20th century. In our time, Stats, particularly frequentist Stats, is greatly outdated and many of the assumptions it makes about the data don’t make any sense. Also, transforming the data so that it fits the assumptions many Stats models make, is a time-consuming process which may or may not be worth the trouble. Of course if you know nothing else, or have trust issues with novel modeling options, then Stats may be the best option for you. In this case, however, it is best to brand yourself as a Stats professional instead of a data scientist, since the latter implies that you do more than just Stats. In addition, pretty much all of the metrics used in Stats can be improved heavily by negating the normality assumption. The more data I come across, the more certain I am that this assumption may make sense in some cases, but in the majority of cases it doesn’t hold. So, using metrics that have this assumption embedded in them doesn’t really help anyone. What’s more, all this framework inevitably shapes one’s mindset and so if you get used to the unreasonable assumptions Stats usually makes about the data, you may not be able to think of the data in a different way. Moreover, with the advent of A.I., especially the A.I. that’s directly applicable to data science, the data transformation and modeling options available to data scientists have increased dramatically. So, relying on Stats is more of a preference rather than a necessity. Besides, it’s extremely unlikely that a Stats model will be able to outperform an A.I. one when the latter is well configured. Finally, there are other new data analytics methods waiting to be discovered and used in data science. Heuristics have made a comeback and are more and more popular in data science research, especially when it comes to complex datasets. So, sticking to Stats when there is a plethora of possibilities out there that can tackle a problem more effectively is just depressing. Having said all that, Stats is a useful subject to learn, as it can aid one’s learning of the data science craft. Much like learning basic Mechanics can be useful if you want to being a Physics professional, learning Stats can be quite useful. Sticking to it and thinking of it as gospel, however, is not. That’s why after learning about it, it’s best to seek to expand your understanding of data analytics through delving into other frameworks, such as Machine Learning, A.I. based systems, and heuristics. Stats is just one of the tools available in the data scientist's toolbox... 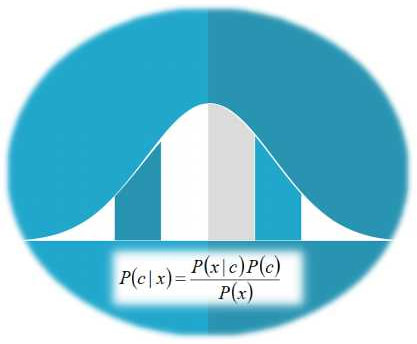 Although the debate between Frequentist and Bayesian statisticians sometimes takes a more comical turn (XKCD strip), it is still important for a data scientist to know a few things about Bayesian Stats. Of course, purists of the craft will argue that Frequentist Stats will suffice but if you want to stand out of the crowd, it would definitely help going beyond the beaten path, when it comes to data analytics know-how.
This video I made recently highlights the key elements of Bayesian Stats, focusing on the concepts that although fairly straight-forward, may be obscure to the newcomer. Also, without disregarding the invaluable contribution of Frequentist Stats to data science, this video explores how the two differ and how Bayesian Stats has a lot in common with other, more modern, data analytics frameworks. Check it out when you get the chance! Note that a subscription to the Safari platform is necessary in order to view the video in its entirety.  Dichotomy: a binary separation of a set into two mutually exclusive subsets Data Science: the interdisciplinary field for analyzing data, building models, and bringing about insights and/or data products, which add value to an organization. Data science makes use of various frameworks and methodologies, including (but not limited) to Stats, ML, and A.I. After getting these pesky definitions out of the way, in an effort to mitigate the chances of misunderstandings, let’s get to the gist of this fairly controversial topic. For starters, all this information here is for educational purposes and shouldn’t be taken as gospel since in data science there is plenty of room for experimentation and someone adept in it doesn’t need to abide to this taxonomy or any rules deriving from it. The inaccurate dichotomy issues in data science, however, can be quite problematic for newcomers to the field as well as for managers involved in data related processes. After all, in order to learn about this field a considerable amount of time is required, something that is not within the temporal budget of most people involved in data science, particularly those who are starting off now. So, let’s get some misconceptions out of the way so that your understanding of the field is not contaminated by the garbage that roams the web, especially the social media, when it comes to data science. Namely, there are (mis-)infographics out there that state that Stats and ML are mutually exclusive, or that there is no overlap between non-AI methods and ML. In other words, ML is part of AI, something that is considered blasphemy in the ML community. The reason is simple: ML as a field was developed independently of AI and has its own applications. AI can greatly facilitate ML through its various network-based models (among other systems), but ML stands on its own. After all, many ML models are not AI related, even if AI can be used to improve them in various ways. So, there is an overlap between ML and AI, but there are non-AI models that are under the ML umbrella. Same goes with Statistics. This proud sub-field of Mathematics has been the main framework for data analytics for a long time before ML started to appear, revolting against the model-based approach dictated by Stats. However, things aren’t that clear-cut. Even if the majority of Stats models are model-based, there are also models that are hybrid, having elements of Stats and ML. Take Bayesian Networks for example, or some variants of the Naive Bayes model. Although these models are inherently Statistical, they have enough elements of ML that they can be considered ML models too. In other words, they lie on the nexus of the two sets of methods. What about Stats and AI? Well, Variational AutoEncoders (VAEs) are an AI-based model for dimensionality reduction and data generation. So, there is no doubt that it lies within the AI set. However, if you look under the hood you’ll see that it makes use of Stats for the figuring out what the data generated by it would be like. Specifically, it makes use of distributions, a fundamentally statistical concept, for the understanding and the generation of the data involved. So, it wouldn’t be far-fetched to put VAEs in the Stats set too. From all this I hope it becomes clear that the taxonomy of data science models isn’t that rigid as it may seem. If there was a time when this rigid separation of models made sense, this time is now gone as hybrid systems are becoming more and more popular, while at the same time the ML field expands in various directions outside AI. So, I’d recommend you take those (mis-)infographics with a pinch of salt. After all, most likely they were created by some overworked employee (perhaps an intern) with a limited understanding of data science.  A famous scientist from the Quantum Physics school of thought once said “asking the right question is more than halfway towards finding the answer.” Although it’s been years since I read this quote (which I may be paraphrasing, by the way), it still echoes a deep truth and helps guide my (non-academic) research in the data science and A.I. fields. So, I few weeks ago I put forward the question “what would a statistical framework framed around possibilities be like?” At first glance, such a question may seem nonsensical since from an early age we’ve all be taught the core aspects of Stats and how it’s all about probabilities. There is no doubt that the probabilistic approach to modeling uncertainty has yielded a lot of fruits as the field grew, but all developments of Statistical methods were bound by the limitations of the assumptions made, mirrored by the various distributions used. In other words, if you want results with conventional Stats, you’ve got to use this or the other distribution and keep in mind that if the data you have doesn’t follow the distribution assumed, the results may not be reliable. What if the field of Stats was void of such restrictions by assuming a membership function instead of a distribution, to describe the data at hand? I’m not going to describe in length where this rabbit hole leads, but suffice to say that the preliminary results of a framework based on this alternative approach exceeded my expectations. Also, there is no Stats process that I looked at which could not be replicated with the possibilistic approach. What’s more, since the possibilistic approach to data analytics is one of the oldest forms of A.I., it is sensible to say that such a statistical framework would be in essence AI-based, though not related to deep learning, since that’s a completely different approach to A.I. that has its own set of benefits. Nevertheless, I found that having a statistical framework that borrows an A.I. concept in its core, can provide an interesting way to bridge the gap between Stats-based data analytics and modern / A.I. based. What’s even more interesting is that this can be a two-way street, with A.I. also being able to benefit from such a nexus between the two fields. After all, one of the biggest pain points of modern A.I. is the lack of transparency, something that’s a freebie when it comes to Stats modeling. So, an A.I. system that has elements of Stats at its core may indeed be a transparent one. However, this idea is still highly experimental, so it would be best to not discuss it further here. Whatever the case, I have no doubt that the possibilistic approach to data has a lot of merit and hasn’t been explored enough. So, it is possible that it has a role to play in more modern data analytics systems. The question is, are you willing to accept this possibility? |
Zacharias Voulgaris, PhDPassionate data scientist with a foxy approach to technology, particularly related to A.I. Archives
December 2022
Categories
All
|
 RSS Feed