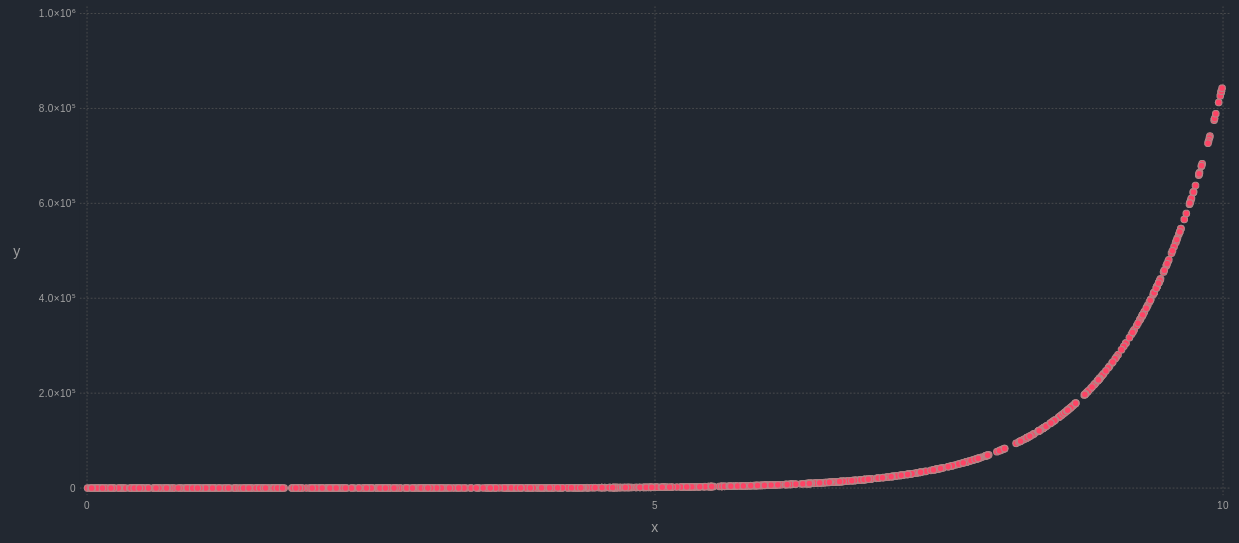
 Before someone says “yes, of course; you just need to apply a non-linear transformation to one of the variables!”, let me rephrase: can we measure a non-linear relationship between two variables, without any transformations whatsoever? In other words, is there a heuristic metric that can facilitate the task of establishing whether two variables are linked in some fashion, without any data engineering from our part? The answer is “yes, of course” again. However, the relationship has to be monotonous for this to work. In other words, there needs to be a 1-1 relationship between the values of the two variables. Otherwise, it may not appear as strong, due to the nature of non-linearity. So, if we have two variables x and y, and y is something like x^10 + exp(x), that’s a relationship that is clearly non-linear, but also monotonous. Also, the Pearson correlation of the two variables in this case is not particularly strong (for the variables tested, it was about 0.67). If it were measured by a different correlation metric, however, like a custom-built one I’ve recently developed, the relationship would be somewhat stronger (for these variables, it would be around 0.75) while Kendall's ranked correlation coefficient would produce a great result too (1.00 for these variables). In a different scenario, where z = 1 / x, for example, the results of the correlation metrics differ more. Pearson’s correlation in this case would be something like -0.16, while the custom-made metric would yield something around -0.69. Also, Kendall’s coefficient would be -1.00. Although the effect is not always pronounced, in cases like this one, a different metric can make the difference between a strong correlation and a not-so-strong one, affecting our decisions about the variables. Bottom line, even if the Pearson correlation coefficient is the most popular method for measuring the relationship between two variables, it’s not the best choice when it comes to non-linear relationships. That’s why different metrics need to be used for evaluating the relationship between two variables, particularly if it’s a non-linear one.
0 Comments
Revisiting Dimensionality Reduction (Conventional Methods with an Unconventional Approach)6/18/2018  Although I’ve talked about dimensionality reduction for data science in the corresponding video on Safari, covering various angles of the topic, I was never fully content with the methodologies out there. After all, all the good ones are fairly sophisticated, while all the easier ones are quite limited. Could there be a different (better) way of performing dimensionality reduction in a dataset? If so, what issue would such a method tackle? First of all, conventional dimensionality reduction methods tend to come from Statistics. That’s great if the dataset is fairly simple, but methods like PCA focus on the linear relationships among the features, which although it’s a good place to start, it doesn’t cover all the bases. For example, what if features F1 and F2 have a non-linear relationship? Will PCA be able to spot that? Probably not, unless there is a strong linear component to it. Also, if F1 and F2 follow some strange distribution, the PCA method won’t work very well either. What's more, what if you want to have meta-features that are independent to each other, yet still explain a lot of variance? Clearly PCA won’t always give you this sort of results, since for complex datasets the PCs will end up being tangled themselves. Also, ICA, a method designed for independent components, is not as easy to use since it’s hard to figure out exactly where to stop when it comes to selecting meta-features. In addition, what’s the deal with outliers in the features? Surely they affect the end result, by changing the whole landscape of the features, breaking the whole scale equilibrium at times. Well, that’s one of the weak point of PCA and similar dimensionality reduction methods, since they require some data engineering before they can do their magic. Finally, how much does each one of the original features contribute to the meta-features you end up with after using PCA? That’s a question that few people can answer although the answer is right there in front of them. Also, such a piece of information may be useful in evaluating the original features or providing some explanation of how much they are worth in terms of predictive potential, after the meta-features are used in a model. All of these issues and more can be tackled by using a new approach to dimensionality reduction, one that is based on a new paradigm (the same one that can tackled the clustering issues mentioned in the previous post). Also, even though the new approach doesn’t use a network architecture, it can still be considered a type of A.I. as there is some kind of optimization involved. As for the specifics of the new approach, that’s something to be discussed in another post, when the time is right...  A/B testing is a crucial methodology / application in the data science field. Although it mainly relies on Statistics, it has a remained quite relevant in this machine learning and AI oriented era of our field. It's no coincidence that in Thinkful that's one of the first things data science students learn, once they get comfortable with descriptive Stats and basic data manipulation. So, I decided to do a video on this topic to help those interested in learning about it get a good perspective of it and understand better its relationship with Hypothesis Testing. It is my hope that this video can be a good supplement to one's learning on the subject. Enjoy!
 Even though this topic may be a bit polarizing, especially among people who are new to data science, knowing more about it can be very useful, particularly if you value a sense of perspective more than a good grade in some data science crash course. The latter is bound to overemphasize either Stats or AI, depending on the instructor's knowledge and experience. However, some data science professionals, myself included, prefer a more balanced approach on the topic. This is the reason why I decided to make this video, which is now available on Safari for your viewing. Note that this is by no means a complete tutorial on the topic, but it is a good overview of the various aspects of statistics related to data science, along with some programming resources in both Python and Julia, to get you started. Enjoy!  After investigating this topic quite a bit, as I was looking into A.I. stuff, I decided to create a video on it. To make it more complete, I included other methods too, such as Statistics-based and heuristics-based ones. Despite the excessive amount of content I put together into this project (the script was over 4000 words), I managed to keep the video at a manageable length (a bit less than half an hour). Check it out on Safari when you have some time!  I've mentioned both in the DS Modeling Tutorial and in another article of mine the importance of discretization / binning of a continuous variable, as a strategy for turning it into a feature, to be used in a data model. However, how meaningful and information-rich the resulting categorical feature is going to be depends on the thresholds we use. In this post I'd like to share with you a strategy that I've come up with that works well in doing just that. First of all, we need to make sure we have a potent method for calculating the density of a data point. I'm not talking about probability density though, since the latter is a statistical concept that has more to do with the mathematical form of a distribution than the actual density observed. The actual density is what we would measure if we were to look at the data itself and although it's quite straight-forward, it's not as easy to do at scale. That's why I first developed a very simple (almost simplistic) method for approximating density using a sampling of sorts, rather than looking at each individual element in the variable. Afterwards, we just need to figure out the point of least density, that's not an extreme of the variable. In other words, identity of a local minimum in the density distribution, a fairly easy task that's also computationally cheap. Of course it's good to have a threshold too, to distinguish between this point being an actual low-density point and one that could be due to chance. If the density of that point is below this threshold, we can take it to be a point of dissection for the variable, effectively binarizing it. Beyond that, we can repeat the same process recursively, for the two partitions of the variable. This way, we can end up with 3, 4, or even 100 partitions at the end of the process. This is another reason why this aforementioned threshold is very important. After all, not all partitions would be binarizable in a meaningful way. Also, it would be a good idea to have a limit to how many partitions overall we allow, so that we don't end up with a categorical variable having 1000 unique values either! This optimal discretization / binning process is very simple and robust, resulting into a simpler form of the original variable, one that can be broken down to a set of binary features afterwards, if needed. This can also be useful in identifying potential outliers and being able to use them (as separate values in the new feature) instead of discarding them. The method is made even faster through its implementation in Julia, which once again proved itself as a great DS tool.  Introduction The idea of sampling is fundamental in data science and even though it is taught in every data science book or course out there, there is still a lot to be learned about it. The reason is that sampling is a very deep topic and just like every other data-related topic out there, conventional Statistics fails to do it justice. The reason is simple: good quality samples come about by obtaining an unbiased representation of a population and this is rarely the case from strictly random samples. Also, the fact that Statistics doesn’t offer any metric whatsoever regarding bias in a sample, doesn’t help the whole situation. The Index of Bias (IB) of a Sample There are two distinct aspects of a sample, its bias and its diversity. Here we’ll explore the former, as it is expressed in the two fundamental aspects of a distribution, its central point and its spread. For these aspects we’ll use two robust and fairly stable metrics, the median and the inter-quartile range, respectively. The deviation of a sample in terms of these metrics, with each deviation normalized based on the maximum deviation possible for the given data, yields two metrics, one of the central point and one for the spread. Each metric takes values between 0 and 1, inclusive. The average of these metrics is defined as the index of bias of a sample and takes values in the [0, 1] interval too. Note that the index of bias is always in relation to the original dataset we take the sample from. Although the above definition applies to one-dimensional data only, it can be generalized to n-dimensional data too. For example, we can define the index of bias of a dataset comprising of d dimensions (features) as the arithmetic mean of the index of bias of each one of its features. IB Scores for Various Samples Strictly random samples tend to have a fairly high IB score, considering that we expect them to be unbiased. That’s not to say that they are always very biased, but they are definitely in need of improvement. Naturally, if the data we are sampling is multi-dimensional, the chances of a bias are higher, resulting to an overall biased sample. Samples that are engineered with IB in mind are more likely to be unbiased in that sense. Naturally, this takes a bit of effort. Still, given enough random samples, it is possible to get a good enough sample that is unbiased based on this metric. In the attached file I include the IB scores of various samples, for both a random sampling process (first column) and a more meticulous one that aims to obtain a less biased sample (second column). Note that the latter did not use the IB metric in its algorithm, though a variant of it that makes use of that metric is also available (not free though). Also, you don’t need to be an expert in statistical tests to see that the second sampling method is consistently better than the first one. Finally, I did other tests on different data, and in every case, the results were very similar. Conclusions Hopefully, this small experiment goes on to show how sampling is not a trivial problem as it is made out to be by those who follow some old-fashioned paradigm for data analytics. Despite its simplicity, sampling has a lot of facets that need to be explored and understood, before it can be leveraged as a data science technique. After all, what good is an advanced model if the data it is trained on is biased? I believe we owe it to ourselves as data scientists to pay attention to every part of the data science process, including the less interesting parts, such as sampling.
 First of all, let’s get something straight. I love Statistics and find their role in Data Science a very important one. I’d even go so far as to say that they are essential, even if you specialize in some part of data science that doesn’t need them per se. With this out of the way, I’d like to make the argument that the role of Stats in predictive analytics models in data science is very limited, especially nowadays. Before you move on to another website, bear with me, since even if you don’t agree, being aware of this perspective may be insightful to you. In general terms, predictive analytics models in data science are the models we build to find the value of a variable using some other variables, usually referred to as features. A predictive analytics model can be anything that provides a mapping between these features and the variable we want to predict (the latter is usually referred to as the target variable). Depending on the nature of the target variable, we can have different methodologies, the most important of which are classification and regression. These are also the most commonly used predictive analytics models out there. Statistics has been traditionally used in various ways in these predictive analytics models. This kind of statistics is under the umbrella of “inference statistics” and it used to have some merit when it came to predictions. However, nowadays there are much more robust models out there, some machine learning based, so A.I. based, and some that are combinations of various (non-statistical) models. Many of these models tend to perform quite well, while at the same time, they all refrain from making any assumptions about the data and the distributions it follows. Most inference statistical models are very limited in that respect as they expect their variables to follow certain distributions and/or to be independent of each other. Because of all that, nowadays data science professionals tend to rely on non-statistical methods for the predictive analytics models they develop. That’s not to say that Stats are not useful though. They may still offer value in various ways, such as sampling, exploratory analysis, dimensionality reduction, etc. So, it’s good to have them in your toolbox, even if you’ll probably not rely on them if you plan to develop a more robust predictor in your data science project.  !ommon sense would dictate that this is not possible. After all, there are numerous articles out there (particularly on the social media) using that as a sign of a fallacy in an argument. Things like “most people claim that they have better than average communication skills, which is obviously absurd!” are not uncommon. However, a data scientist is generally cautious when it comes to claims that are presented without proof, as she is naturally curious and eager to find out for herself if that’s indeed the case. So, let’s examine this possibility, free from prejudice and the views of the know-it-alls that seem to “know” the answer to this question, without ever using a programming language to at least verify their claim. The question is clear-cut and well-defined. However, our common sense tells us that the answer is obvious. If we look into it more deeply though and are truly honest with ourselves, we’ll find out that this depends on the distribution of the data. A variable may or may not follow the normal distribution that we are accustomed to. If it doesn’t it’s quite likely that it is possible for the majority of the data points in a variable to be larger than the average value of that variable. After all, the average value (or arithmetic mean as it is more commonly known to people who have delved into this matter more), is just a measure of central tendency, certainly not the only measure for figuring out the center of a distribution. In the normal distribution, this metric coincides in value with that of median, which is always in the center of a variable, if you order its values in ascending or descending order. However, the claim that mean = median (in value) holds true only in cases of a symmetric distribution (like the normal distribution we are so accustomed to assuming it characterizes the data at hand). If the distribution is skewed, something quite common, it is possible to have a mean that is smaller than the median, in which case, the majority of the data points will be towards the right of it, or in layman’s terms, higher in value than the average. Don’t take my word for it though! Attached is a script in Julia that generates an array that is quite likely to have the majority of its elements higher in value than its overall mean. Feel free to play around with it and find out by yourselves what the answer to this question is. After all, we are paid to answer questions using scientific processes, instead of taking someone else’s answers for granted, no matter who that person is.
 Recently I read an article on Pulse (LinkedIn) that was talking about what to look for when hiring a statistician. This shocked me for two reasons. 1. The role of the statistician is becoming obsolete, giving way to that of the data scientist and the A.I. professional. 2. If you need help for hiring someone in a profession that has been around for over a century, then no article can help you, no matter how well-written the article is. I have no opinion on the article itself. I’m sure its author meant well and that he did his research prior to writing it. I do have a view on the whole matter though and how oftentimes the market is lagging in its understanding of what data analytics entails. So, let me clarify some things on this, since I've worked in this field for the largest part of my career. Data analytics involves various sub-fields, such as statistics, business intelligence, data science, and modern A.I.-based predictive analytics. Statistics is a great tool, something that every self-respecting data scientist needs to know (though its usefulness is not limited to data science). However, a statistician is an overly specialized professional who relies on Stats primarily for his analyses. This is like someone who is a professional traveler (say a blogger of sorts specializing in touristic destinations and such), who only uses his car to go to the various countries he visits. Of course driving can get you to many places, depending on where you start from, but this way you miss out on all the islands, as well as Australia. There is nothing wrong with using your car to go to places, but if you want to be a professional traveler, you need to use other modes of transport too (otherwise you’ll never get to Victoria, BC, which is awesome, especially at this time of the year). So, if you want to get a good story on the various beautiful spots someone can go to in the Hawaii islands, the aforementioned overly specialized professional traveller may not be able to deliver. However, someone who is more versatile and doesn’t mind using a plane once in a while, can get you that story and do so fairly quickly (especially if he is based in the West Coast). That latter professional traveller is the equivallent of a data scientist. Nowadays, the world needs people who are versatile and comfortable with technology. In the previous example, they need someone who not only drives a car, but also knows how it works and is able to fix it if it doesn’t drive well. The statistician may know how to drive various vehicles (statistical models), but is usually unable to do more than drive. A data scientist, on the other hand, is quite comfortable with all kinds of modes of transport and can even build one from scratch (given enough expertise, of course). So, if you were to hire someone to get that data to talk, who are you going to go with, the overly specialized statistician or the versatile data scientist? |
Zacharias Voulgaris, PhDPassionate data scientist with a foxy approach to technology, particularly related to A.I. Archives
December 2022
Categories
All
|
||||
 RSS Feed